Unlock a world of possibilities! Login now and discover the exclusive benefits awaiting you.
- Qlik Community
- :
- All Forums
- :
- QlikView App Dev
- :
- Do While loop
- Subscribe to RSS Feed
- Mark Topic as New
- Mark Topic as Read
- Float this Topic for Current User
- Bookmark
- Subscribe
- Mute
- Printer Friendly Page
- Mark as New
- Bookmark
- Subscribe
- Mute
- Subscribe to RSS Feed
- Permalink
- Report Inappropriate Content
Do While loop
I have ship dates that the user can select and as they select it changes the values of another field in a chart. The goal is for this field value to be equal or greater than another value, which is calculated. The user has requested that I automate this process so when the calculated field value is set, the ship dates are advanced until the chart field is equal to or just greater than the calculated field. Can anyone assist me with the script that would do this?
Message was edited by: James Walsh
- Mark as New
- Bookmark
- Subscribe
- Mute
- Subscribe to RSS Feed
- Permalink
- Report Inappropriate Content
I tried adding your expression to "Tons to Pour by Alloy" chart but the expression comes back null. I need the application to perform as it does now except automate the Pour Date selection to stop when Net Good Tons is = or > the goal of Net Tons to Pour.
- Mark as New
- Bookmark
- Subscribe
- Mute
- Subscribe to RSS Feed
- Permalink
- Report Inappropriate Content
See my new attachment for an example of the needed outcome. Thanks!
- Mark as New
- Bookmark
- Subscribe
- Mute
- Subscribe to RSS Feed
- Permalink
- Report Inappropriate Content
Is what I asking for possible (see new messages and updated attachment)?
- Mark as New
- Bookmark
- Subscribe
- Mute
- Subscribe to RSS Feed
- Permalink
- Report Inappropriate Content
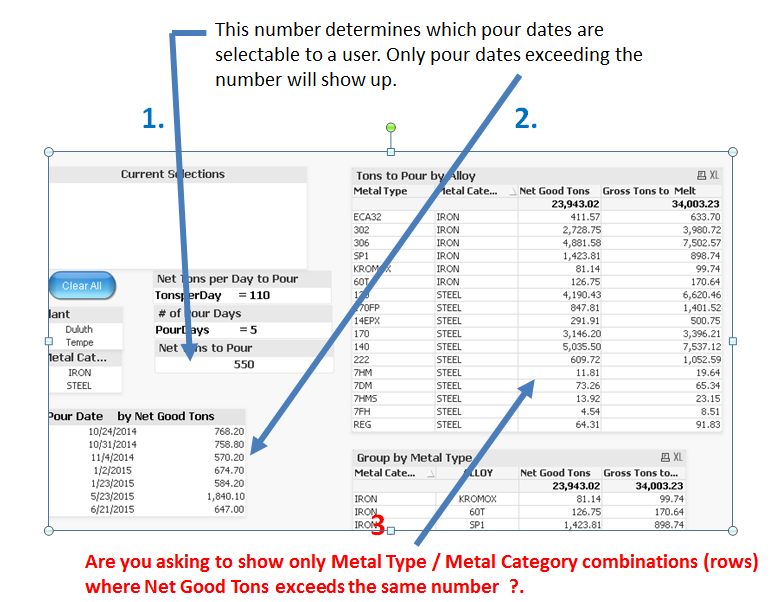
Hi - i didn't see any new attachments in the recent posts and i am not certain what the described need is. To improve communication i've pasted below an attempt of what i think you are asking for. I think you are asking for #3 below... to only show rows that exceed the number computed on the right . Can you please clarify with screenshots / explanations as below ? thank you !
- Mark as New
- Bookmark
- Subscribe
- Mute
- Subscribe to RSS Feed
- Permalink
- Report Inappropriate Content
I edited the first posting with an attachment that shows what I am trying to do. Can you not see that attachment any longer?
- Mark as New
- Bookmark
- Subscribe
- Mute
- Subscribe to RSS Feed
- Permalink
- Report Inappropriate Content
You should be able to see the attachment if go to the Discuss Forum and click on my posting(s).
Thanks!
- Mark as New
- Bookmark
- Subscribe
- Mute
- Subscribe to RSS Feed
- Permalink
- Report Inappropriate Content
Jonathan - Can you see the attachment I am speaking of? If so, can this be done in QlikView?
Thanks!
- Mark as New
- Bookmark
- Subscribe
- Mute
- Subscribe to RSS Feed
- Permalink
- Report Inappropriate Content
Hi James - i saw a description in a text box on the first tab. I sort of understood it but needed to spend more time on it . I got caught up on a few things but when i get back to my list of 'more intensive community threads' this is in my top 3.
- Mark as New
- Bookmark
- Subscribe
- Mute
- Subscribe to RSS Feed
- Permalink
- Report Inappropriate Content
Thanks again.
- Mark as New
- Bookmark
- Subscribe
- Mute
- Subscribe to RSS Feed
- Permalink
- Report Inappropriate Content
James i think this is possible but the way i see it , the model needs a new table that would track dates 'cumulatively'.
Say the dates in my chart were
Date
1/1/2014
1/2/2014
1/3/2014
I would create a new table with Date and CumulativeDateBucket like this:
CumulativeDateBucket Date
1 1/1/2014
2 1/1/2014
2 1/2/2014
3 1/1/2014
3 1/2/2014
3 1/3/2014
so that i have a bucket that will map in all the previous dates.
then i'm thinking of a SET ANALYSIS statement that would return the set of cumulativedatebucket's that have a sum( NETGOODTONS) > 'the user inputed calculated result'. You are allowed to do this in SET ANALYSIS (use aggregation functions in the set modifier) its in the help.
And the set expression would go within a min() function that returns the smallest cumulativedatebucket . That cumulativedatebucket value would be selected through a 'select in field' action button that the user hits and it will indirectly select all the dates up to that datebucket.
sounds great but i don't have a ready sample for you ! can you go on this for a bit ? I'm tapped out until next week