Unlock a world of possibilities! Login now and discover the exclusive benefits awaiting you.
- Qlik Community
- :
- All Forums
- :
- QlikView App Dev
- :
- Double entries
- Subscribe to RSS Feed
- Mark Topic as New
- Mark Topic as Read
- Float this Topic for Current User
- Bookmark
- Subscribe
- Mute
- Printer Friendly Page
- Mark as New
- Bookmark
- Subscribe
- Mute
- Subscribe to RSS Feed
- Permalink
- Report Inappropriate Content
Double entries
Hello,
I'm new to Qlikview and I have a few questions 
- I have two tables.
One table contains a calendar with dates/months etc.
One table contains the issues from my helpdesk tool.
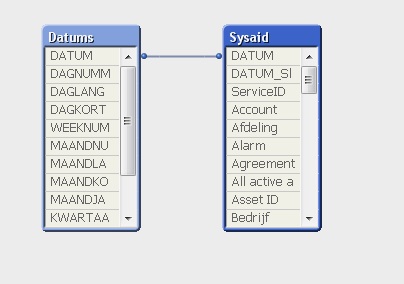
Qlikview creates an automatic relation between the datum fields (Date) which is perfect.
All my filters work fine but I have empty rows of dates on the date rows where I don't have issues. This is because my calendar table has more dates in the past and future than my helpdesktool has issues. This makes sense..
How can I filter these lines? I don't want to see the dates which don't have issues.
Should I use a third table with a resident load ?
And my second question. Is it possible to create two piecharts at the same location? For example:
Piechart 1 contains the main selection--> Click on a selection --> Piechart 1 shows the sub selection of the selected main.
Thank you!
- Tags:
- new_to_qlikview
Accepted Solutions
- Mark as New
- Bookmark
- Subscribe
- Mute
- Subscribe to RSS Feed
- Permalink
- Report Inappropriate Content
Hi,
Table box should work fine. But you need to click on field Status, Service and Titel and check the "Omit Rows..." That means that if the row has a null value for that field, the entire row is hidden. If that does not work as expected, create a new object, Chart, type straight table to keep it the most similar to what you are showing above, and set Jaarkort, Maandkort as dimensions, and
Only(Status)
Only(ServiceID)
Only(Titel)
as expressions.
Hope that helps.
Miguel
- Mark as New
- Bookmark
- Subscribe
- Mute
- Subscribe to RSS Feed
- Permalink
- Report Inappropriate Content
i think, you need a third table with resident load
load*
resident table where not( isnull(Status) and isnull(ServiceID) and isnull(Titel));
For the second question I dont't have Idea 😞
- Mark as New
- Bookmark
- Subscribe
- Mute
- Subscribe to RSS Feed
- Permalink
- Report Inappropriate Content
Hi,
To the first question: if you are using a tablebox, go to the object Properties, Presentation tab, just click on the corresponding field (for example, Status) and check where "Omit Rows Where Field Is NULL". If you show that in a chart, the aggregation function (for example, Sum()) will only show those dates with values.
To the second question, create a drill down group with the two fields you want to show. Go to the Settings menu, Document Properties, Groups, add a new Drill Down group and add the fields you want to keep in the hierarchy (Field1 when clicked all values in Field2...)
Hope that helps.
Miguel
- Mark as New
- Bookmark
- Subscribe
- Mute
- Subscribe to RSS Feed
- Permalink
- Report Inappropriate Content
Thank you for the response!
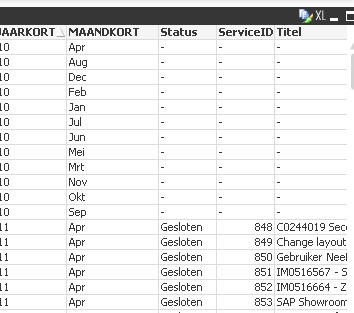
I can't use the "Omit Rows Where Field Is NULL" function because the enrty is not 'NULL" there are filled in rows :
As you can see I still see the rows without a serviceID.
Maybe I'm using the incorrect table box.
I want to do this:
Show a field with the following fields:
Jaarkort ( from the calendar table) ( translation: year)
Maandkort ( from the calendar table) (translation: month)
Status (from the helpdesk table)
ServiceID (from the helpdesk table)
Title(from the helpdesk table)
I would like to see a list where only the rows with a serviceid are shown. So that I can easily export that selection to Excell.
Answer two was perfect!
- Mark as New
- Bookmark
- Subscribe
- Mute
- Subscribe to RSS Feed
- Permalink
- Report Inappropriate Content
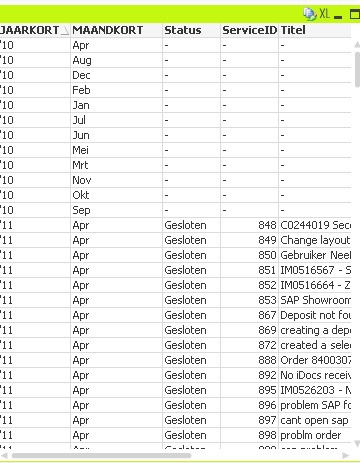
Hi,
Table box should work fine. But you need to click on field Status, Service and Titel and check the "Omit Rows..." That means that if the row has a null value for that field, the entire row is hidden. If that does not work as expected, create a new object, Chart, type straight table to keep it the most similar to what you are showing above, and set Jaarkort, Maandkort as dimensions, and
Only(Status)
Only(ServiceID)
Only(Titel)
as expressions.
Hope that helps.
Miguel
- Mark as New
- Bookmark
- Subscribe
- Mute
- Subscribe to RSS Feed
- Permalink
- Report Inappropriate Content
Miguel,
Thanks! That worked perfect. I used the "Omit Rows..." solution on the fields.