Unlock a world of possibilities! Login now and discover the exclusive benefits awaiting you.
- Qlik Community
- :
- All Forums
- :
- QlikView App Dev
- :
- Re: Draw Reference Line
- Subscribe to RSS Feed
- Mark Topic as New
- Mark Topic as Read
- Float this Topic for Current User
- Bookmark
- Subscribe
- Mute
- Printer Friendly Page
- Mark as New
- Bookmark
- Subscribe
- Mute
- Subscribe to RSS Feed
- Permalink
- Report Inappropriate Content
Draw Reference Line
Hi guys,
I have a linear chart, with months on the x-aixs and costs on the y-axis, like this:
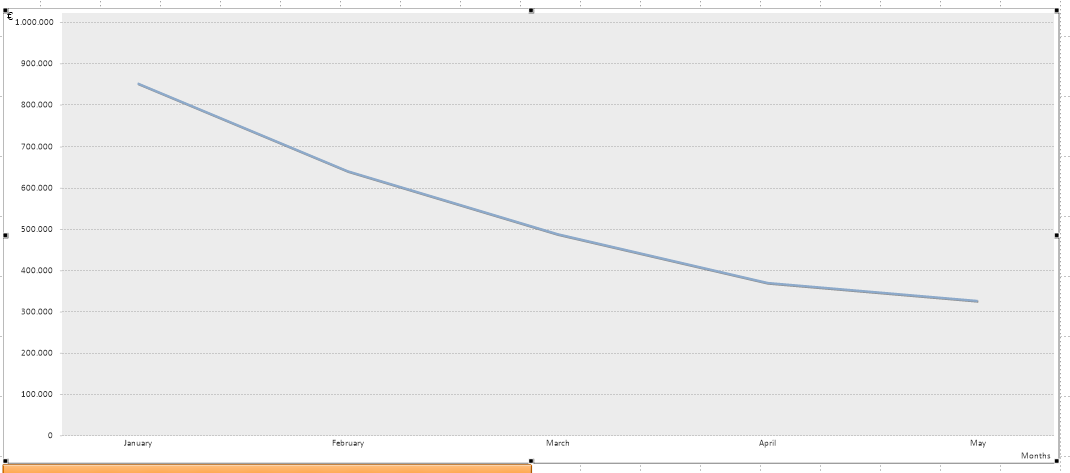
Now I would draw a vertical line inside a linear graph, and this line should indicate the current month, like this:

I draw the red line with paint.
I can't use Reference Lines option, because on x-axis I don't have number, but string.
Someone can help me to find a solution?
Thanks
- Mark as New
- Bookmark
- Subscribe
- Mute
- Subscribe to RSS Feed
- Permalink
- Report Inappropriate Content
Hi Andrea,
You won't be able to use vertical reference lines unless you use a continuous x-axis (found in axis, between the "axis colours" at the left).
Since you're using months, I think you could convert it to Date and then you'd be able to check the continous axis, thus enabling this option.
Regards,
Sorin.
- Mark as New
- Bookmark
- Subscribe
- Mute
- Subscribe to RSS Feed
- Permalink
- Report Inappropriate Content
i.sanz11 is correct , you need to have continuous x-axis to get the verticall reference line ...try to have dual format for your Month dim and try that could help
- Mark as New
- Bookmark
- Subscribe
- Mute
- Subscribe to RSS Feed
- Permalink
- Report Inappropriate Content
I did what you said.
Now the x-axis values looks like this:
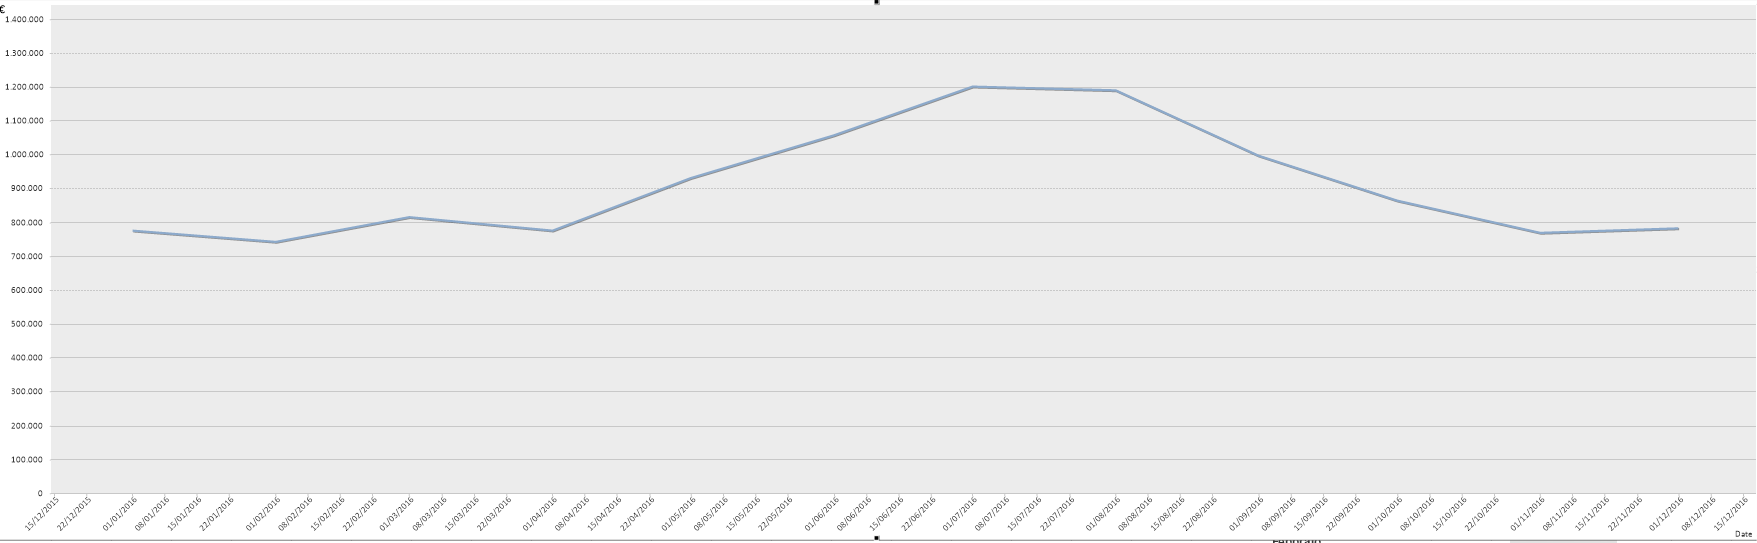
How can I show only the first day of the month, like this:
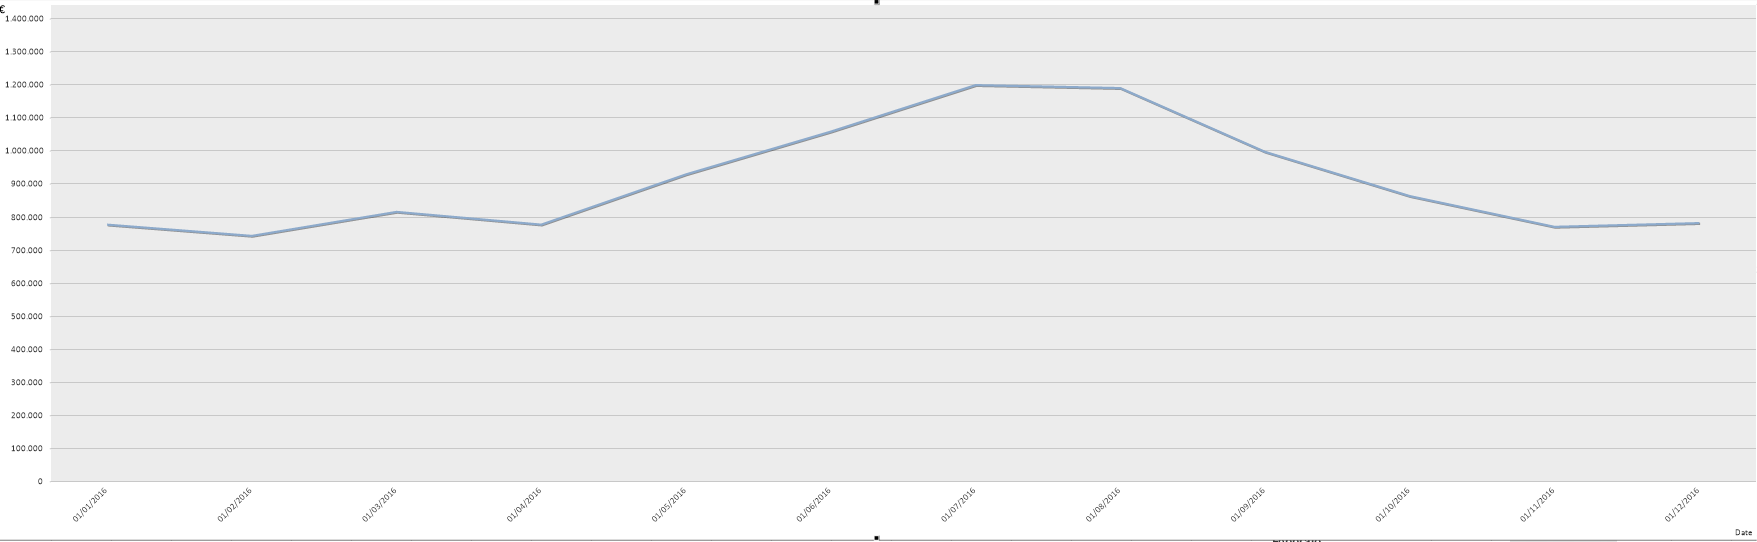
In this second image I disabled the continuous option, but in this case Reference Lines option doesn't work
- Mark as New
- Bookmark
- Subscribe
- Mute
- Subscribe to RSS Feed
- Permalink
- Report Inappropriate Content
Hi,
could you use a combo chart and add Expression like if(Months=vPreviousMonth, 150.00) and use bar?
- Mark as New
- Bookmark
- Subscribe
- Mute
- Subscribe to RSS Feed
- Permalink
- Report Inappropriate Content
An error bar can almost do it , except a little bit garbages at the end of the line
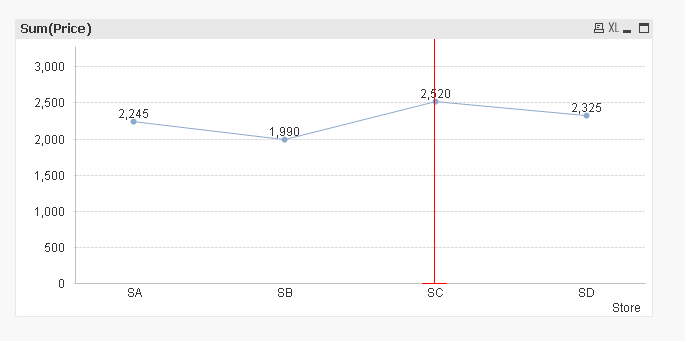
plz find attachment , for your infomation
- Mark as New
- Bookmark
- Subscribe
- Mute
- Subscribe to RSS Feed
- Permalink
- Report Inappropriate Content
continuous x-axis + reference line + text on axis will make perfect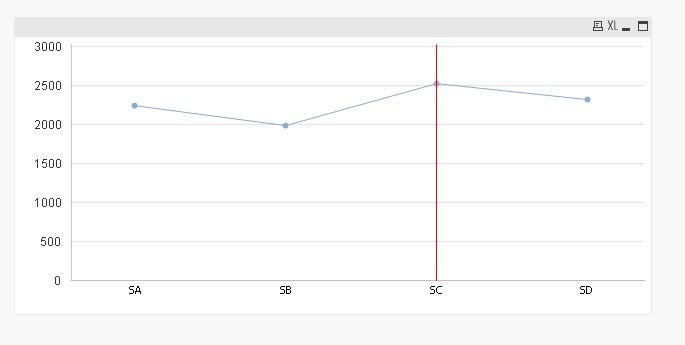
PFA