Unlock a world of possibilities! Login now and discover the exclusive benefits awaiting you.
- Qlik Community
- :
- All Forums
- :
- QlikView App Dev
- :
- Re: Duplicates counting and flagging
- Subscribe to RSS Feed
- Mark Topic as New
- Mark Topic as Read
- Float this Topic for Current User
- Bookmark
- Subscribe
- Mute
- Printer Friendly Page
- Mark as New
- Bookmark
- Subscribe
- Mute
- Subscribe to RSS Feed
- Permalink
- Report Inappropriate Content
Duplicates counting and flagging
Dear all,
I got stuck on what seemed a simple problem.
I have a table A with fields
A.id, ... ,
A.text
Lets say that it looks like this:
| A.id | A.text |
|---|---|
| 1 | ALPHA |
| 2 | BRAVO |
| 3 | ALPHA |
| 4 | CHARLIE |
In a pivot chart, I would like to show, which texts have duplicates and count the number of duplicates:
| A.text | Flag multiple |
|---|---|
ALPHA | 1 |
| BRAVO | 0 |
| CHARLIE | 0 |
| SUM | 1 |
I tried if-clauses:
if( count ({<...>}A.text) - count (distinct {<..>}A.text)=0, 0,1)
Nice and simple. That does in fact deliver the correct result - but it fails to work in summing up. As QV considers the if-clause for all the datasets above, I will always get a "1" instead of the number of terms with duplicates ("Doubletten").
So, I also tried aggr with an aggregation level ("Team number") several tables away
sum(aggr( if( count ({<...>}A.text) - count (distinct {<..>}A.text)=0, 0,1) ), A.text)
And here it starts getting messy, as some values are correct, some are not and the whole thing changes with the selections I make. Weird. Unfortunatly, I can not post the data here...
I thought of mapping the data into a separate table by script, but there must be a somewhat more elegant way to this.
Have I overlooked a much more simple way?
How would you approach such a task?
Any help greatly appreciated,
best regards,
Boris
Accepted Solutions
- Mark as New
- Bookmark
- Subscribe
- Mute
- Subscribe to RSS Feed
- Permalink
- Report Inappropriate Content
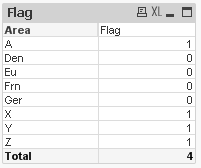
Try this,
Pivot chart with,
Dimension: A.Text
Expression: =sum(aggr(if(Count(A.Text)<=1,0,1),A.Text))
From Presentation tab 'UnCheck' the 'Suppress Zero-Values' option
I am getting below result
- Mark as New
- Bookmark
- Subscribe
- Mute
- Subscribe to RSS Feed
- Permalink
- Report Inappropriate Content
In a pivot chart, I would like to show, which texts have duplicates and count the number of duplicates
What happens if you simply select A.Text as dimension and Count(A.id) as the expression?
- Mark as New
- Bookmark
- Subscribe
- Mute
- Subscribe to RSS Feed
- Permalink
- Report Inappropriate Content
This will show the duplicate count of A.Text
- Mark as New
- Bookmark
- Subscribe
- Mute
- Subscribe to RSS Feed
- Permalink
- Report Inappropriate Content
I mean if the exact expression we use like if(Count(A.id)>1,1,0) to denote duplicate as 1, shouldn't this simple expression work or not?
- Mark as New
- Bookmark
- Subscribe
- Mute
- Subscribe to RSS Feed
- Permalink
- Report Inappropriate Content
it works, but sub total is coming to 1. Not the total of duplicates.
- Mark as New
- Bookmark
- Subscribe
- Mute
- Subscribe to RSS Feed
- Permalink
- Report Inappropriate Content
Got it, to get the right total we need to aggregate the results in expression. Thanks 
- Mark as New
- Bookmark
- Subscribe
- Mute
- Subscribe to RSS Feed
- Permalink
- Report Inappropriate Content
what could be the output for this data with correct total?
| ID | TEXT |
| 1 | A |
| 2 | B |
| 3 | A |
| 4 | A |
| 5 | B |
| 6 | C |
- Mark as New
- Bookmark
- Subscribe
- Mute
- Subscribe to RSS Feed
- Permalink
- Report Inappropriate Content
| TEXT | Flag |
| A | 1 |
| B | 1 |
| C | 0 |
| total | 2 |
The idea is to figure out, how many texts (which correspond to companies in my QV-data) overlap in various fields of business.
I found the solution: sum(aggr(if(Count(A.Text)<=1,0,1),A.Text)) as suggested by Mayuresh above works fine. My question was not sufficiently precise, I am a bit of an aggr-rookie... 🙂
But as I needed an aggregation in a pivot chart, I had to use a second aggr level, else the results would vary according to the filters applied.
So, I used count(aggr(sum(aggr(count (distinct A.text), A.id)),Team_Number))
This may not be the most elegant solution, but it works.
Thanks for your help!
- Mark as New
- Bookmark
- Subscribe
- Mute
- Subscribe to RSS Feed
- Permalink
- Report Inappropriate Content
Thank you, Mayuresh!
Your solution works within the table, but I actually applied a different version.
Your suggestion got me there by getting me off the idea of substracting count to count distinct.
Instead, I now use count (aggr (sum(aggr (count (distinct A.text), A.id)), Team_Number))
I am a bit of an aggr-newbie, so I got stuck on using just one aggr-level in a pivot table and then got confused about the verying results all according to the filters applied. . 
best regards,
Boris