Unlock a world of possibilities! Login now and discover the exclusive benefits awaiting you.
- Qlik Community
- :
- All Forums
- :
- QlikView App Dev
- :
- Re: Duplicates in the display
- Subscribe to RSS Feed
- Mark Topic as New
- Mark Topic as Read
- Float this Topic for Current User
- Bookmark
- Subscribe
- Mute
- Printer Friendly Page
- Mark as New
- Bookmark
- Subscribe
- Mute
- Subscribe to RSS Feed
- Permalink
- Report Inappropriate Content
Duplicates in the display
Dear QV Experts
When i select the Month ' July' from the list box, i was surprised to see one additional rows.
After analysis i found due to the Newserv Id, though the Acknowledgement Sent Date Column in Jan 2016, it displays in July 2015.
The Expression used,
= Count({<DateType = {'Received'}>}Acknowledgement)
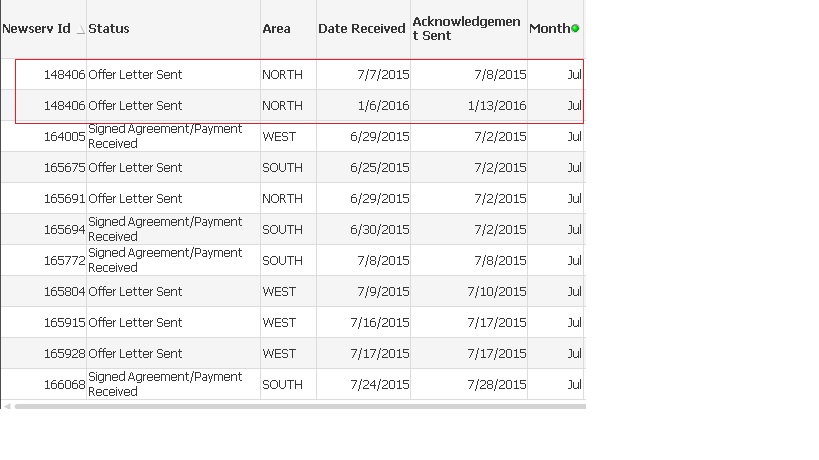
Can you please suggest me how to get rid of this duplicate row.
- Tags:
- new_to_qlikview
- « Previous Replies
-
- 1
- 2
- Next Replies »
Accepted Solutions
- Mark as New
- Bookmark
- Subscribe
- Mute
- Subscribe to RSS Feed
- Permalink
- Report Inappropriate Content
Maybe like attached.
I've removed the syn table by dropping one table and changed the key for the link table.
- Mark as New
- Bookmark
- Subscribe
- Mute
- Subscribe to RSS Feed
- Permalink
- Report Inappropriate Content
= Count(DISTINCT{<DateType = {'Received'}>}Acknowledgement)
- Mark as New
- Bookmark
- Subscribe
- Mute
- Subscribe to RSS Feed
- Permalink
- Report Inappropriate Content
May be this:
=Count({<DateType = {'Received'}, [Newserv Id] = {"=[Acknowledgement Sent Date] = Max(TOTAL <[Newserv Id]>[Acknowledgement Sent Date])"}>}Acknowledgement)
- Mark as New
- Bookmark
- Subscribe
- Mute
- Subscribe to RSS Feed
- Permalink
- Report Inappropriate Content
How is your month field related to the two dates shown in the chart.
Maybe it's also related to [Date Received], which is July?
- Mark as New
- Bookmark
- Subscribe
- Mute
- Subscribe to RSS Feed
- Permalink
- Report Inappropriate Content
Yes you are right, I helped OP to implement a Canonical Calendar in one of the previous posts.
UPDATE: Link to previous post -> How to have two date for a list box
- Mark as New
- Bookmark
- Subscribe
- Mute
- Subscribe to RSS Feed
- Permalink
- Report Inappropriate Content
Thanks Suresh, Sunny.
But the solution is not working for me.
- Mark as New
- Bookmark
- Subscribe
- Mute
- Subscribe to RSS Feed
- Permalink
- Report Inappropriate Content
Hi Sasi,
Could you please explain a bit more?
1) From where you are deriving the month field?
2) What is the relationship or link between month table and DataType, Acknowledgement, NewServ Id, Status, Area, Date Received and Acknowledgement Sent
-Sathish
- Mark as New
- Bookmark
- Subscribe
- Mute
- Subscribe to RSS Feed
- Permalink
- Report Inappropriate Content
Any other expressions / set analysis used?
Could you share a sample QVW?
- Mark as New
- Bookmark
- Subscribe
- Mute
- Subscribe to RSS Feed
- Permalink
- Report Inappropriate Content
Please find enclosed the qvw & input file.
If Dec month selected. then one additional row of January also displayed.
This is because of unique Newserv id.
Please suggest me how to get rid of this.
- Mark as New
- Bookmark
- Subscribe
- Mute
- Subscribe to RSS Feed
- Permalink
- Report Inappropriate Content
Hi Sasi,
Two things I have noted.
1) Remove synthetic key
2) some of the id is repeating Example 143678, How the id will repeat?
-Sathish
- « Previous Replies
-
- 1
- 2
- Next Replies »