Unlock a world of possibilities! Login now and discover the exclusive benefits awaiting you.
- Qlik Community
- :
- All Forums
- :
- QlikView App Dev
- :
- Dynamic Dimensions
- Subscribe to RSS Feed
- Mark Topic as New
- Mark Topic as Read
- Float this Topic for Current User
- Bookmark
- Subscribe
- Mute
- Printer Friendly Page
- Mark as New
- Bookmark
- Subscribe
- Mute
- Subscribe to RSS Feed
- Permalink
- Report Inappropriate Content
Dynamic Dimensions
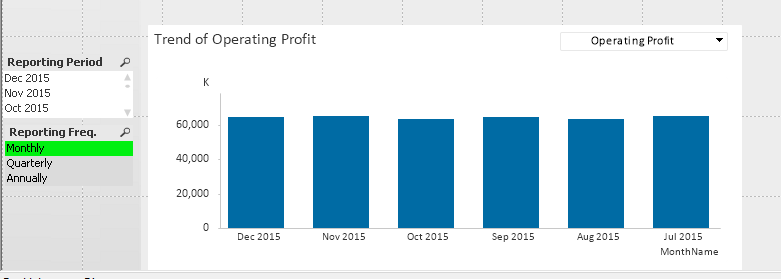
Hi, new to Qlikview here and I am trying to create a bar chart with a dynamic time dimension.
Behaviour of the chart should be like this:
When selecting "Monthly" in the Reporting Freq. field, the dimension will only show the current selection for Month and the previous 5 months.
When selecting "Quarterly", the dimension will only show the current selection for Quarter and the previous 3 quarters.
When selecting "Yearly" the dimension will only show the current year and the year before.
I was wondering if this can be acheived by using calculated dimensions and sets to limit the dimensions? Any help will be much appreciated, thanks!
- Mark as New
- Bookmark
- Subscribe
- Mute
- Subscribe to RSS Feed
- Permalink
- Report Inappropriate Content
Hi Ying,
How does look your source table, if you Show your example then we can find appropriate solution for your issue
beck
- Mark as New
- Bookmark
- Subscribe
- Mute
- Subscribe to RSS Feed
- Permalink
- Report Inappropriate Content
I think you could do it with an expression like:
sum({< $(=only(FrequenzNum)) = {">=$(=max($(=only(FrequenzNum)))- $(=only(FrequenzNumParameter)))"}>} Value)
and a dimension like:
$(=only(FrequenzDim))
whereby FrequenzNum, FrequenzNumParameter and FrequenzDim belong to the same table like your listbox-field Reporting Freq. like this one:
table:
load * inline [
Reporting Freq., FrequenzNum, FrequenzNumParameter, FrequenzDim
Monthly, MonthNum, 5, YearMonth
Quarterly, QuarterNum, 3, Quarter
...
];
- Marcus