Unlock a world of possibilities! Login now and discover the exclusive benefits awaiting you.
- Qlik Community
- :
- All Forums
- :
- QlikView App Dev
- :
- Dynamic change the color of Line chart
- Subscribe to RSS Feed
- Mark Topic as New
- Mark Topic as Read
- Float this Topic for Current User
- Bookmark
- Subscribe
- Mute
- Printer Friendly Page
- Mark as New
- Bookmark
- Subscribe
- Mute
- Subscribe to RSS Feed
- Permalink
- Report Inappropriate Content
Dynamic change the color of Line chart
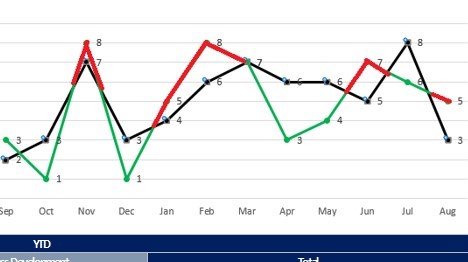
i want to change the color of the line chart in QlikView if certain conditions are met. But i don't want the entire line color to change.
there are 2 lines.
Line 1 : Actual Cost
Line 2 : Forecast Gross Cost
i want only the color of the affected portion to change color. For example on line 1, if the Forecast > Actual for the month of November, i want just that portion of the line to turn red(), else, it should be blue().
Anyone have any thoughts on how to achieve this?
i have tried using the 'special segments' portion on the 'colors' tab, but it doesn't work.
i have also tried using a formula in the colors, but it changes the ENTIRE line color, which is not what i want.
let me know if there is a workaround for this
i have attached te QV file as well
thanks!
Accepted Solutions
- Mark as New
- Bookmark
- Subscribe
- Mute
- Subscribe to RSS Feed
- Permalink
- Report Inappropriate Content
In the "Background Color" of the expression, you can try:
=If([Gross Costs Forecast] > [Gross Costs Actual],Red(),Blue())
The color only changes at the periods.
- Mark as New
- Bookmark
- Subscribe
- Mute
- Subscribe to RSS Feed
- Permalink
- Report Inappropriate Content
NOTE!
i have updated the data for the QV file here.
Sorry about that!
- Mark as New
- Bookmark
- Subscribe
- Mute
- Subscribe to RSS Feed
- Permalink
- Report Inappropriate Content
In the "Background Color" of the expression, you can try:
=If([Gross Costs Forecast] > [Gross Costs Actual],Red(),Blue())
The color only changes at the periods.
- Mark as New
- Bookmark
- Subscribe
- Mute
- Subscribe to RSS Feed
- Permalink
- Report Inappropriate Content
Something like this?
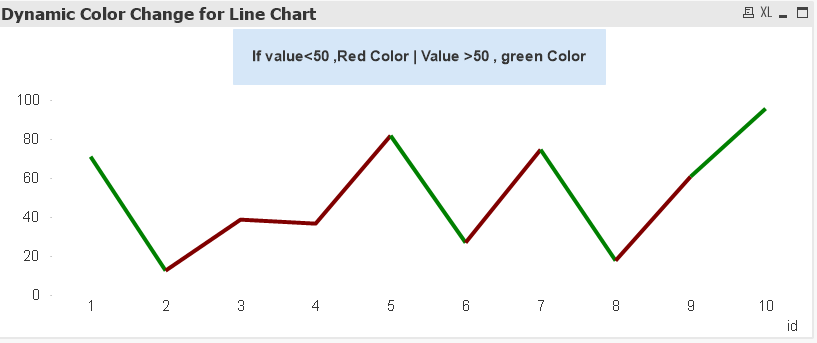
Check out this attached demo and replace with you values.
- Mark as New
- Bookmark
- Subscribe
- Mute
- Subscribe to RSS Feed
- Permalink
- Report Inappropriate Content
thanks for your time and response Krishna!