Unlock a world of possibilities! Login now and discover the exclusive benefits awaiting you.
- Qlik Community
- :
- All Forums
- :
- QlikView App Dev
- :
- Dynamic dimension
- Subscribe to RSS Feed
- Mark Topic as New
- Mark Topic as Read
- Float this Topic for Current User
- Bookmark
- Subscribe
- Mute
- Printer Friendly Page
- Mark as New
- Bookmark
- Subscribe
- Mute
- Subscribe to RSS Feed
- Permalink
- Report Inappropriate Content
Dynamic dimension
Hi,
I have table as follows (lets call it 'Contact' table):
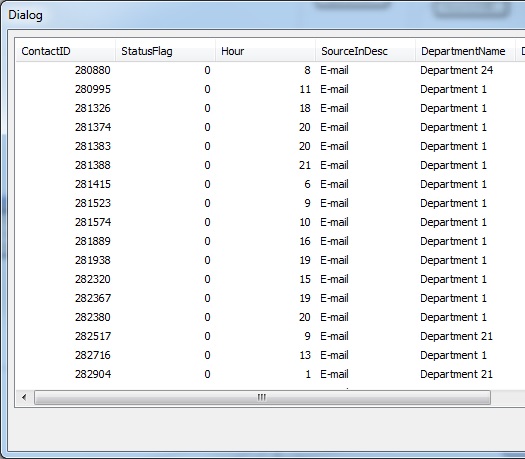
And a chart that displays that Contact table:
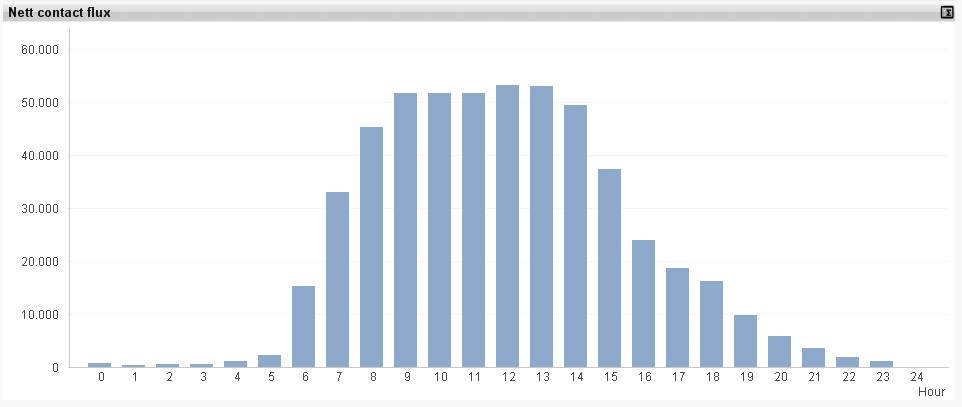
The chart would say: we have x contacts that was created at hour 6, y contacts created at hour 7, etc, etc.
The problem is: is that possible to display the number of contacts that were created at an hour+N?
The N is a variable that can be changed via a slider, and the bar chart will dynamically change as user moves the slider. If the N is set to 2, the contact ID 280880 will have 'Hour' value 10, contact 280995 will have 'Hour' value 13, etc., and this 'new values' will be shown in the chart.
The dimension is an inline table consisting number 1 to 24, to show 24 hour time.
Appreciate your help. Thanks.
- Mark as New
- Bookmark
- Subscribe
- Mute
- Subscribe to RSS Feed
- Permalink
- Report Inappropriate Content
Change your Hour dimension to a calculated dimension: =Hour+$(vOffSetVariable)
talk is cheap, supply exceeds demand