Unlock a world of possibilities! Login now and discover the exclusive benefits awaiting you.
- Qlik Community
- :
- All Forums
- :
- QlikView App Dev
- :
- Empty Values
- Subscribe to RSS Feed
- Mark Topic as New
- Mark Topic as Read
- Float this Topic for Current User
- Bookmark
- Subscribe
- Mute
- Printer Friendly Page
- Mark as New
- Bookmark
- Subscribe
- Mute
- Subscribe to RSS Feed
- Permalink
- Report Inappropriate Content
Empty Values
I have a pivot table
with several dimensions
e.g.
2015 nr. diff. 2014 nr diff.
jan 10 10 20 -
feb 20 10 30 -
mrt 30 10 40 -
the difference column is difference between actual and previous year
you see also that difference of 2014 is empty because there is not a previous year
how can i change the column properties so that empty diff columns are not shown?
- Mark as New
- Bookmark
- Subscribe
- Mute
- Subscribe to RSS Feed
- Permalink
- Report Inappropriate Content
Hi,
Did you try the "Suppress When Value is Null" in the Dimension Tab?
- Mark as New
- Bookmark
- Subscribe
- Mute
- Subscribe to RSS Feed
- Permalink
- Report Inappropriate Content
Hello a.domevscek,
Under expressions you want to conceal when they didn’t yield a result, what you could do in the ‘Conditional Show’ expression is calculate the reporting expression, aggregating over dimensions used in the pivot table, and suppress when no values are detected.
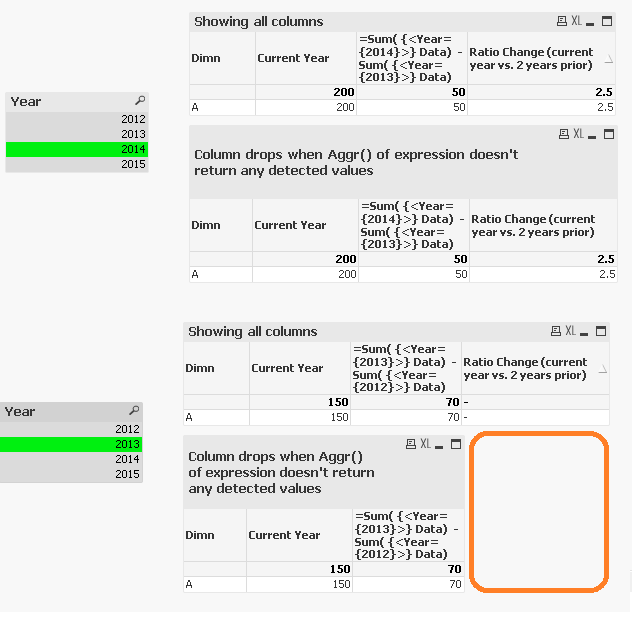
Here’s an example where an expression calculating ratio of current year against two years prior goes blank when the current year pushes 2 years prior “off the edge of the data”, and the ratio calculation starts returning null (because 2 years prior isn't in the data set)
=IF(Fabs(Max(Aggr(Sum( {<Year={$(=Max(Year))}>} Data) / Sum( {<Year={$(=Max(Year - 2))}>} Data), Dimn))) > 0, 1, 0)
If that Aggr() expression fails to produce a result, then the column isn’t calculating anything, and you can set the conditional show = 0, which will hide the column.
- Mark as New
- Bookmark
- Subscribe
- Mute
- Subscribe to RSS Feed
- Permalink
- Report Inappropriate Content
This (using conditional expression) will not work if you want to use the same expression evaluated for two or more dimensional values (like 2014, 2015), but only hide it for one. The condition will be evaluated once per chart, not per dimensional value.
In this scenario, I don't think you can hide the expression column for the specific dimensional value.
- Mark as New
- Bookmark
- Subscribe
- Mute
- Subscribe to RSS Feed
- Permalink
- Report Inappropriate Content
Yes, I agree swuehl.
In my example, the pivot table is using "straight table style" expressions, where each expression refers to a specific relative year, and the year dimension has not been pivoted to the horizontal axis.
I've seen plenty of pivot tables used solely to expand or collapse the vertical axis, and that's what I thought we were dealing with here.
So I agree my suggested approach won't work for the chart configuration you described. To produce a.domevscek's shown result table though, neither configuration has been ruled out. If he is interested in showing the yearly delta for every year in a data set spanning many years, then putting the year field in the horizontal axis would produce many columns and you can't pick and choose which to suppress or not. In my example, the expressions only deal with the actual and previous year and doesn't place the year dimension in the horizontal axis.