Unlock a world of possibilities! Login now and discover the exclusive benefits awaiting you.
- Qlik Community
- :
- All Forums
- :
- QlikView App Dev
- :
- Error in calculated dimension
- Subscribe to RSS Feed
- Mark Topic as New
- Mark Topic as Read
- Float this Topic for Current User
- Bookmark
- Subscribe
- Mute
- Printer Friendly Page
- Mark as New
- Bookmark
- Subscribe
- Mute
- Subscribe to RSS Feed
- Permalink
- Report Inappropriate Content
Error in calculated dimension
Hi all,
I am newbie of QV software so i want to ask y my chart will shown to me with Error in calculated dimension?what's wrong with my problems?? sry for asking a noobie question....
- Tags:
- new_to_qlikview
- Mark as New
- Bookmark
- Subscribe
- Mute
- Subscribe to RSS Feed
- Permalink
- Report Inappropriate Content
In the reply select....use advanced editor at the right top and u will find attachment option in the right down!!!!
- Mark as New
- Bookmark
- Subscribe
- Mute
- Subscribe to RSS Feed
- Permalink
- Report Inappropriate Content
In your expression Aggr((Wu+Wv*Median(uETFintercept)),Dimension)
U cant give as Dimension
Dimension means column name
Aggr function is like group by in sql
In the place of dimension give your column name by which you want your expression to group by
Hope you understand
- Mark as New
- Bookmark
- Subscribe
- Mute
- Subscribe to RSS Feed
- Permalink
- Report Inappropriate Content
Hi,
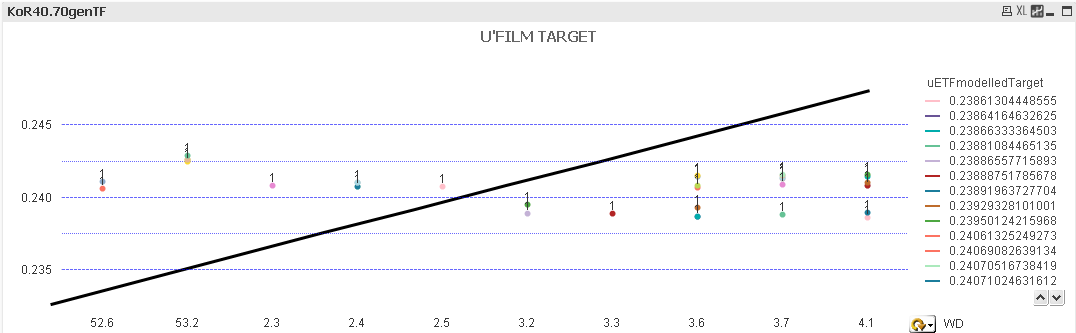
What if you can overlap chart on top of other. Base chart will be a median trendline and top one will be your actual chart. See attachment
PS: You have to do lots of work in order to create perfect visualization. For example, you need to adjust axis and hide them if required, transparent background, adjust min/max axes etc.
- Mark as New
- Bookmark
- Subscribe
- Mute
- Subscribe to RSS Feed
- Permalink
- Report Inappropriate Content
BUT why i unable to add a refference line on my scatter chat??
- Mark as New
- Bookmark
- Subscribe
- Mute
- Subscribe to RSS Feed
- Permalink
- Report Inappropriate Content
I said know there is a error in your expression. use a column name in the place of dimension
- Mark as New
- Bookmark
- Subscribe
- Mute
- Subscribe to RSS Feed
- Permalink
- Report Inappropriate Content
Ya i put it already but still cant get the refference line....mayb i use wrong column name??
- Mark as New
- Bookmark
- Subscribe
- Mute
- Subscribe to RSS Feed
- Permalink
- Report Inappropriate Content
share that expression
- Mark as New
- Bookmark
- Subscribe
- Mute
- Subscribe to RSS Feed
- Permalink
- Report Inappropriate Content
((Wu+Wv*Median(uETFintercept)),uETFmodelledTarget)
- Mark as New
- Bookmark
- Subscribe
- Mute
- Subscribe to RSS Feed
- Permalink
- Report Inappropriate Content
i want to ask 1 more question....if i want to manually to set the trendline on my scatter izzit possible or not?bcoz the trendline only hv average,linear,^2,^3,^4 only....if i want to set my own formula as trendline that is possible or not to do it?
- Mark as New
- Bookmark
- Subscribe
- Mute
- Subscribe to RSS Feed
- Permalink
- Report Inappropriate Content
Remove the cyclic drilldown box in x axis. u will get the reference line