Unlock a world of possibilities! Login now and discover the exclusive benefits awaiting you.
- Qlik Community
- :
- All Forums
- :
- QlikView App Dev
- :
- Re: Error in calculated dimension
- Subscribe to RSS Feed
- Mark Topic as New
- Mark Topic as Read
- Float this Topic for Current User
- Bookmark
- Subscribe
- Mute
- Printer Friendly Page
- Mark as New
- Bookmark
- Subscribe
- Mute
- Subscribe to RSS Feed
- Permalink
- Report Inappropriate Content
Error in calculated dimension
Hi all,
I am newbie of QV software so i want to ask y my chart will shown to me with Error in calculated dimension?what's wrong with my problems?? sry for asking a noobie question....
- Tags:
- new_to_qlikview
- Mark as New
- Bookmark
- Subscribe
- Mute
- Subscribe to RSS Feed
- Permalink
- Report Inappropriate Content
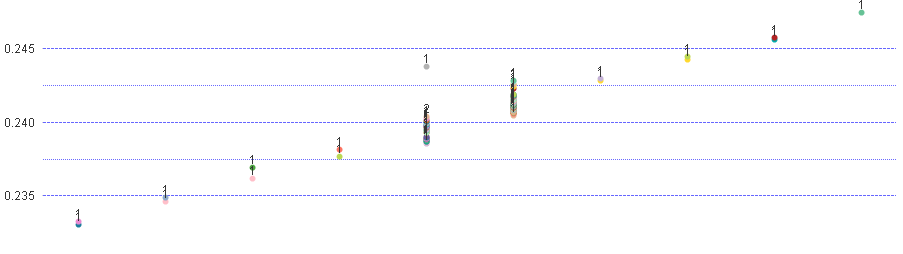
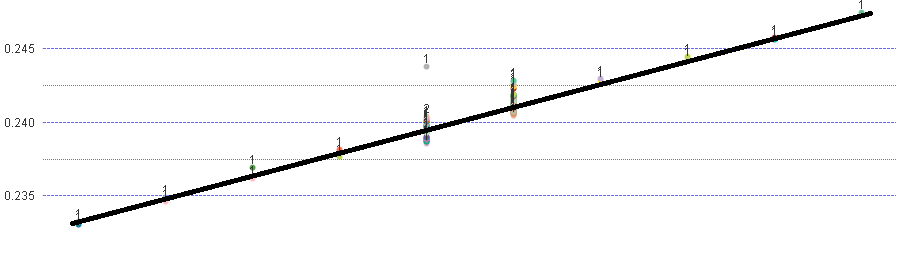
The above is my work nw....i would like to add 1 line as the 2nd picture like that....the line i think can be done by using the refference line rite? but i could not to be add the reffernce line nw.....my formula is =A+B*C is just a simple formula but i not able to do it......
- Mark as New
- Bookmark
- Subscribe
- Mute
- Subscribe to RSS Feed
- Permalink
- Report Inappropriate Content
write only = a+b*c instead of z= a+b*c
Thanks,
AS
- Mark as New
- Bookmark
- Subscribe
- Mute
- Subscribe to RSS Feed
- Permalink
- Report Inappropriate Content
please share your application.
Thanks,
AS
- Mark as New
- Bookmark
- Subscribe
- Mute
- Subscribe to RSS Feed
- Permalink
- Report Inappropriate Content
Hi,
I really don't understand what causing you the issue. The best and quickest way to solve your issue is to provide some sample qvw or some real example.
Thanks
- Mark as New
- Bookmark
- Subscribe
- Mute
- Subscribe to RSS Feed
- Permalink
- Report Inappropriate Content
Hi,
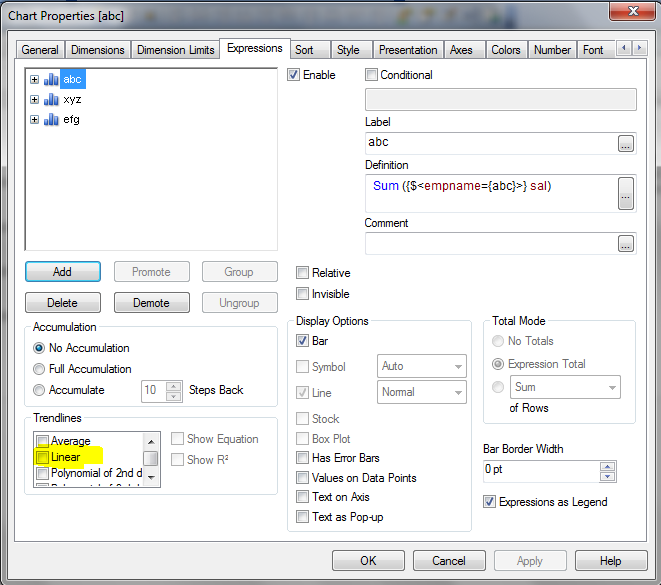
You may have to look into trendlines option available in chart expression tab.
- Mark as New
- Bookmark
- Subscribe
- Mute
- Subscribe to RSS Feed
- Permalink
- Report Inappropriate Content
u can see the picture i post? my problem is i would like to get the second picture from the 1st picture nw. for my thinking is added 1 refference into my scatter chart but i donknow hw to add it. And the refference line should depand on the value from LINE = A + B*C.
- Mark as New
- Bookmark
- Subscribe
- Mute
- Subscribe to RSS Feed
- Permalink
- Report Inappropriate Content
i donknow hw to attach the qvw file....can hlp me?sry....
- Mark as New
- Bookmark
- Subscribe
- Mute
- Subscribe to RSS Feed
- Permalink
- Report Inappropriate Content
Share your sample file.
- Mark as New
- Bookmark
- Subscribe
- Mute
- Subscribe to RSS Feed
- Permalink
- Report Inappropriate Content
Very thank satyadev....nw i able to add the line on my scatter chart already....but the trendlines only can with average,linear like that only? can i get the trendlines depand on my own formula???
- Mark as New
- Bookmark
- Subscribe
- Mute
- Subscribe to RSS Feed
- Permalink
- Report Inappropriate Content
reply--> In the right top u can see Use advanced editor--> right bottom attach