Unlock a world of possibilities! Login now and discover the exclusive benefits awaiting you.
- Qlik Community
- :
- All Forums
- :
- QlikView App Dev
- :
- Re: Exclude Zero bars
- Subscribe to RSS Feed
- Mark Topic as New
- Mark Topic as Read
- Float this Topic for Current User
- Bookmark
- Subscribe
- Mute
- Printer Friendly Page
- Mark as New
- Bookmark
- Subscribe
- Mute
- Subscribe to RSS Feed
- Permalink
- Report Inappropriate Content
Exclude Zero bars
HI ,
I have a requirement to exclude zero bar form a bar chart.
I have two dim and one exprsssion bar chart.
For dim who has no entry wrt to count are also coming in bar chart just name on axis.
how can I exclude this.
I have tried all supress zero, null etc nothing working
- Mark as New
- Bookmark
- Subscribe
- Mute
- Subscribe to RSS Feed
- Permalink
- Report Inappropriate Content
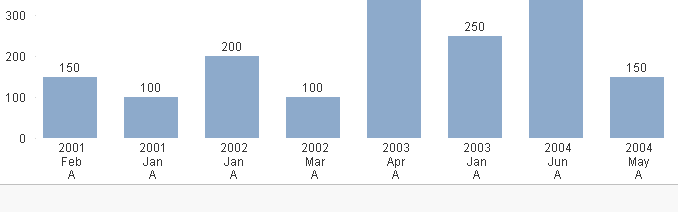
Script
Data:
LOAD
Dim1,
Dim2,
Sales,
Dual(Dim1 & chr(10) & Dim2, autonumber(Dim1) & Ord(Dim2)) as TempDim1
Inline
[
Dim1, Dim2, Sales
2001,Jan,100
2001,Feb,150
2002,Jan,200
2002,Mar,100
2003,Jan,250
2003,Apr,400
2004,May,150
2004,Jun,350
];
Concatenate
LOAD Distinct
Dim1,
'Z1' as Dim2,
Dual('', AutoNumber(Dim1) & Ord('Z')) as TempDim1,
'0' as Sales
Resident Data;
Bar Chart
Dimension
=Aggr(TempDim1, Dim1, Dim2)
Tick Suppress When Value is Null
Expression
SUM(Sales)
- Mark as New
- Bookmark
- Subscribe
- Mute
- Subscribe to RSS Feed
- Permalink
- Report Inappropriate Content
Manish Bhai, Why do we need Concatenate Table? Without Table we can achieve, right?
- Mark as New
- Bookmark
- Subscribe
- Mute
- Subscribe to RSS Feed
- Permalink
- Report Inappropriate Content
ok I missed something
1. I have three dimen
2. my expression is count(status)
now if I assign '0' as Status it is coming in legend also like status closed, opem and 0
I can exclude it but now sure howz this behaving.
Manish can u share your app the test one only.
- Mark as New
- Bookmark
- Subscribe
- Mute
- Subscribe to RSS Feed
- Permalink
- Report Inappropriate Content
You can use same Manish recommend
- Mark as New
- Bookmark
- Subscribe
- Mute
- Subscribe to RSS Feed
- Permalink
- Report Inappropriate Content
Concatenate is better option as we shouldn't keep separate table only for few lines. Performance would be better with concatenating them.
avneet85
Better you provide your application, along with the output you needed in excel file. We will work on it.
- Mark as New
- Bookmark
- Subscribe
- Mute
- Subscribe to RSS Feed
- Permalink
- Report Inappropriate Content
Not a good idea to use three dimensions on x axis. As a rule, when you have 3 dimensions, you should show chart as two dimensions on x axis with stacked chart based on 3rd dimension values and 3 rd dimension as legend.
- Mark as New
- Bookmark
- Subscribe
- Mute
- Subscribe to RSS Feed
- Permalink
- Report Inappropriate Content
Can u please share Qvw for same
- Mark as New
- Bookmark
- Subscribe
- Mute
- Subscribe to RSS Feed
- Permalink
- Report Inappropriate Content
ok let me create one same app as replica , will share soon
- Mark as New
- Bookmark
- Subscribe
- Mute
- Subscribe to RSS Feed
- Permalink
- Report Inappropriate Content
I understand your concern although mrkachhiaimp has given a possible solution. Still you can think of changing a chart type.
Use of Block chart instead of Bar will solve your problem. 

- Mark as New
- Bookmark
- Subscribe
- Mute
- Subscribe to RSS Feed
- Permalink
- Report Inappropriate Content
Hi Please find attached sample application