Unlock a world of possibilities! Login now and discover the exclusive benefits awaiting you.
- Qlik Community
- :
- All Forums
- :
- QlikView App Dev
- :
- Exclude selection in graph
- Subscribe to RSS Feed
- Mark Topic as New
- Mark Topic as Read
- Float this Topic for Current User
- Bookmark
- Subscribe
- Mute
- Printer Friendly Page
- Mark as New
- Bookmark
- Subscribe
- Mute
- Subscribe to RSS Feed
- Permalink
- Report Inappropriate Content
Exclude selection in graph
Hi people,
I want to have my graph not sensible to a year selection, here is the graph : 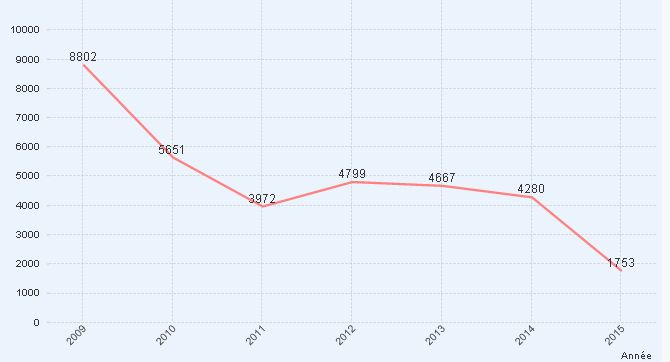
i always want to see the evolution of the curve even when i selected on a particular year.
What i dont want : (when i select on year 2011 for exemple)

Thanks
- Mark as New
- Bookmark
- Subscribe
- Mute
- Subscribe to RSS Feed
- Permalink
- Report Inappropriate Content
It's simple, just add a set analysis to your expressions and boom...
Sum({<yearselection=>} Sales)
in this case your are disregarding the selection of year, so using this you can add month or others
- Mark as New
- Bookmark
- Subscribe
- Mute
- Subscribe to RSS Feed
- Permalink
- Report Inappropriate Content
Add this to your expression:
{<Year = >}
- Mark as New
- Bookmark
- Subscribe
- Mute
- Subscribe to RSS Feed
- Permalink
- Report Inappropriate Content
hello Juan here is a sample of my sintax :
count({$<Origine={"MT"}, Nature={"I"},monAnnée=>,
Its like that??
the year field is monAnnée.
thanks
- Mark as New
- Bookmark
- Subscribe
- Mute
- Subscribe to RSS Feed
- Permalink
- Report Inappropriate Content
hello Sunny T, here is a sample of my sintax :
count({$<Origine={"MT"}, Nature={"I"},monAnnée=>,
Its like that??
the year field is monAnnée.
thanks
- Mark as New
- Bookmark
- Subscribe
- Mute
- Subscribe to RSS Feed
- Permalink
- Report Inappropriate Content
May be this:
=Count({$<Origine={"MT"}, Nature={"I"}, monAnnée= >} YourField)