Unlock a world of possibilities! Login now and discover the exclusive benefits awaiting you.
- Qlik Community
- :
- All Forums
- :
- QlikView App Dev
- :
- Exclusively Negative values in nested pie; outer p...
- Subscribe to RSS Feed
- Mark Topic as New
- Mark Topic as Read
- Float this Topic for Current User
- Bookmark
- Subscribe
- Mute
- Printer Friendly Page
- Mark as New
- Bookmark
- Subscribe
- Mute
- Subscribe to RSS Feed
- Permalink
- Report Inappropriate Content
Exclusively Negative values in nested pie; outer pie ring (2nd dimension) doesn't appear
In the attached Qlikview, (with this data model):
LOAD * INLINE [
Category, Subcategory, Value, PosOrNeg
Fruit, Apple, 3, Positive
Fruit, Banana, -2, Negative
Vegetable, Carrot, 3, Positive
Vegetable, Pea, 1, Positive
Vegetable, Tomato, -5, Negative
];
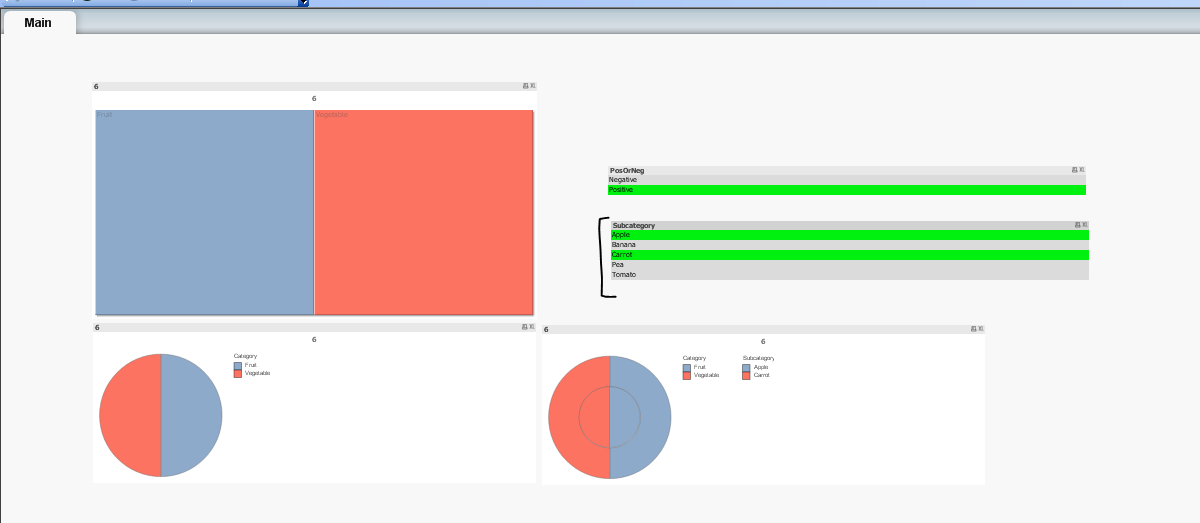
I want to analyze exclusively positive values, so filter on "Positive"
(I also may ignore Peas so I only have Apples and Carrots)
Either way, I can see outer pie ring on the lower-right.
But when I filter on exclusively Negative values, I can no longer see the outer pie ring on the lower-right:
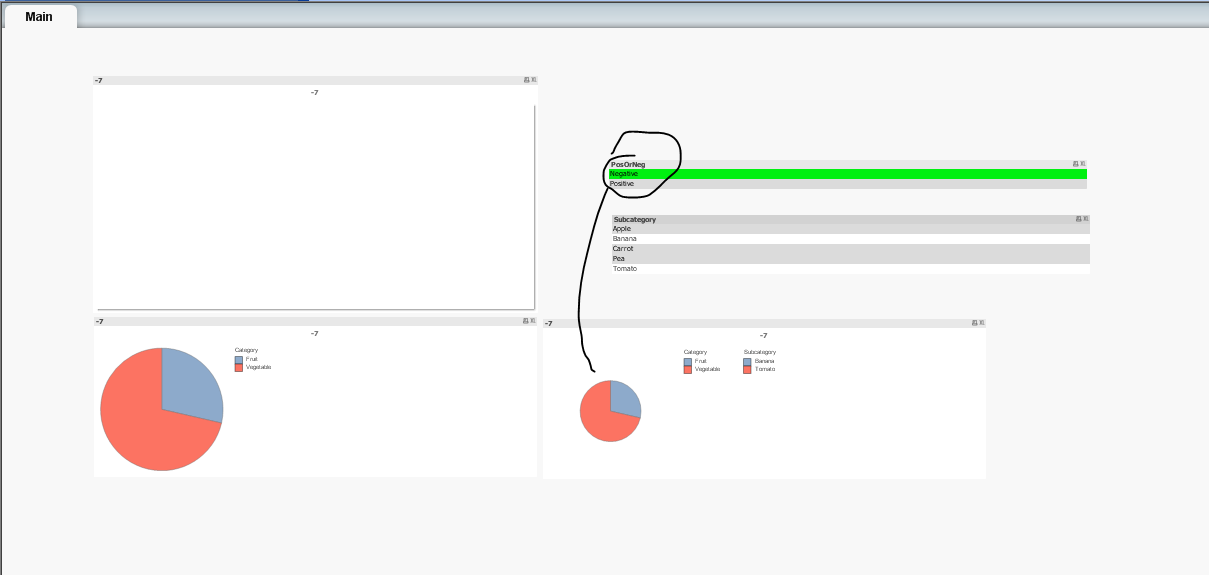 ]
]
I can understand why these things don't support both positive and negative values.
And I know Block charts can't render when values are negative even if a single-level pie chart does work.
But must I accept that a nested pie won't work?
I guess a workaround is to wrap in FABS()?
- Tags:
- nested pie