Unlock a world of possibilities! Login now and discover the exclusive benefits awaiting you.
- Qlik Community
- :
- All Forums
- :
- QlikView App Dev
- :
- Re: Export pivot table with linear gauge charts to...
- Subscribe to RSS Feed
- Mark Topic as New
- Mark Topic as Read
- Float this Topic for Current User
- Bookmark
- Subscribe
- Mute
- Printer Friendly Page
- Mark as New
- Bookmark
- Subscribe
- Mute
- Subscribe to RSS Feed
- Permalink
- Report Inappropriate Content
Export pivot table with linear gauge charts to excel
Hello,
i'm having a pivot table with linear gauge charts and two open requirements:
1. have the values be shown on top of the graph ( i found out already that this does not seem to be possible)
2. The possibility to extract the pivot table into excel including the graphical represenation (build in function allows only to export the data into excel).
Is #2 somehow possible at all?
Cheers in advance
pijatida
- Mark as New
- Bookmark
- Subscribe
- Mute
- Subscribe to RSS Feed
- Permalink
- Report Inappropriate Content
You can copy/paste your chart into Excel
Copy To Clipboard-Image or Object or using Macro to do that but this always will be bitmap
- Mark as New
- Bookmark
- Subscribe
- Mute
- Subscribe to RSS Feed
- Permalink
- Report Inappropriate Content
Yeah.. the bitmap is not helping since it's only part of the table then.. not the part where i would need to scroll down or to the right.
- Mark as New
- Bookmark
- Subscribe
- Mute
- Subscribe to RSS Feed
- Permalink
- Report Inappropriate Content
Could you expand this thought?
Screenshot maybe.
- Mark as New
- Bookmark
- Subscribe
- Mute
- Subscribe to RSS Feed
- Permalink
- Report Inappropriate Content
You may have to use NPrinting to achieve this. Do you have NPrinting available?
Regards,
KKR
- Mark as New
- Bookmark
- Subscribe
- Mute
- Subscribe to RSS Feed
- Permalink
- Report Inappropriate Content
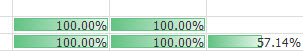
Looks like a Macro is going to do it. currently working on that.
So basically i export a pivot table that shows linear gauge graphs into XL and then run the quick analysis and highlight the cell according to the percentage..
So i have something like this later in Excel....
- Mark as New
- Bookmark
- Subscribe
- Mute
- Subscribe to RSS Feed
- Permalink
- Report Inappropriate Content
You have several options, but not a single straight forward option available !
1) Use Macro to export your table...
2) copy image and past to excel
3) NPrinting
- Mark as New
- Bookmark
- Subscribe
- Mute
- Subscribe to RSS Feed
- Permalink
- Report Inappropriate Content
Yeah.. will probably go with option 1