Unlock a world of possibilities! Login now and discover the exclusive benefits awaiting you.
- Qlik Community
- :
- All Forums
- :
- QlikView App Dev
- :
- Expression/Dimension
- Subscribe to RSS Feed
- Mark Topic as New
- Mark Topic as Read
- Float this Topic for Current User
- Bookmark
- Subscribe
- Mute
- Printer Friendly Page
- Mark as New
- Bookmark
- Subscribe
- Mute
- Subscribe to RSS Feed
- Permalink
- Report Inappropriate Content
Expression/Dimension
So I have an expression that should look at a Unit ( #, %, Days, etc) and realise that if the Unit is a % to change the Target number (97% from excel document cell) to 97% in a QV straight chart table. It changes the value which is great.
However, I dont want the output to look like this.
| Target | Metric | Target | Metric |
|---|---|---|---|
| 90% | 40% | 90% | 50% |
I want to have there to be two dimensions.
Target appears as 90% but it appears as 0.9 and other values appear as decimals.
This will work for me if I use it as an expression but I dont want a repetitive view of Target Metric Target Metric,
SHould read as Target Metric Metric Metric.
Any help appreciated.
<code>
=if(
(if(Unit = '%', num(avg(Target), '#,##0%'),
if(Unit = 'Days', num(avg(Target), '#,##0'),
num(sum(Target), '#,##0'))))
>=
(if(Unit = '%', num(avg(Target), '#,##0%'),
if(Unit = 'Days', num(avg(Target), '#,##0'),
num(sum(Target), '#,##0')))),
vGreen, vRed)
</code>
- Tags:
- new_to_qlikview
Accepted Solutions
- Mark as New
- Bookmark
- Subscribe
- Mute
- Subscribe to RSS Feed
- Permalink
- Report Inappropriate Content
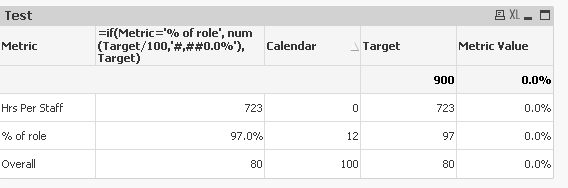
Hi - i put in this expression on the Target Dimension. It seems to work... are you not getting this ?
=if(Metric='% of role', num(Target/100,'#,##0.0%'), Target)
- Mark as New
- Bookmark
- Subscribe
- Mute
- Subscribe to RSS Feed
- Permalink
- Report Inappropriate Content
If this expression is being used in a 'calculated dimension' you usally need to wrap the chart aggregation function (sum , avg etc..) with an aggr()
IE:
change:
sum(Sales)
To:
aggr( sum(Sales), Year)
Where Year is the dimension whose values form the aggregation point for the chart to calculate the expression.
- Mark as New
- Bookmark
- Subscribe
- Mute
- Subscribe to RSS Feed
- Permalink
- Report Inappropriate Content
Apologies, I have explained myself incorrectly.
I've enabled these values in my expression for each month, (Jan-Dec) the Metric Value and Target will show repetively with the correct values. Thats all good but I dont want Target to be shown every month. Rather I want it to be shown once as a column and then Metric Value is to be repeated each month (Jan-Dec).
So when I add Target and Metric Values in my dimensions, the Target does not appear as a % but rather as a decimal. Not all values have % value though so no point in adding this function using the Presentation tab.
The code below works if I put it in the expression but does not work if I put it in the Target dimension.
<code>
if(Unit = '%', num(avg(Target), '#,##0%'),
num(sum(Target), '#,##0'))
</code>
I've tried the aggr() function to no avail also.
- Mark as New
- Bookmark
- Subscribe
- Mute
- Subscribe to RSS Feed
- Permalink
- Report Inappropriate Content
Can you share a QVW that demonstrates the problem and I can tweak a solution ?
- Mark as New
- Bookmark
- Subscribe
- Mute
- Subscribe to RSS Feed
- Permalink
- Report Inappropriate Content
Hey.
Thanks for the assistance.
I've added some dummy inline test data. The first line of date 'hrs per staff' figures wont change.
I'm importing the data using excel and the % of role and overall figures should appear as percentages.
In my original qvw, when I add Target as an expression, the figure will appear as a %. However, this appears as
| Metric | Calendar | Target | Calendar | Target |
|---|---|---|---|---|
| xxx | xxx% | xxxx% | xxx% | xxx% |
| xxx | xxx% | xxxx% | xxx% | xxx% |
What I am trying to achieve is by using the dimensions, Metric, Target, Calender
| Metric | Target | Calendar | Calendar | Calendar |
|---|---|---|---|---|
| xx | xxxx | |||
| 0.96 | 97% | 98% | 99% |
but the Target appears as a decimal but remember, not every target is a percentage so I cannot use the presentation tab to change to all percentages.
Hope this makes sense.
- Mark as New
- Bookmark
- Subscribe
- Mute
- Subscribe to RSS Feed
- Permalink
- Report Inappropriate Content
Hi - i put in this expression on the Target Dimension. It seems to work... are you not getting this ?
=if(Metric='% of role', num(Target/100,'#,##0.0%'), Target)
- Mark as New
- Bookmark
- Subscribe
- Mute
- Subscribe to RSS Feed
- Permalink
- Report Inappropriate Content
Thanks. It worked