Unlock a world of possibilities! Login now and discover the exclusive benefits awaiting you.
- Qlik Community
- :
- All Forums
- :
- QlikView App Dev
- :
- Re: Expression Error
- Subscribe to RSS Feed
- Mark Topic as New
- Mark Topic as Read
- Float this Topic for Current User
- Bookmark
- Subscribe
- Mute
- Printer Friendly Page
- Mark as New
- Bookmark
- Subscribe
- Mute
- Subscribe to RSS Feed
- Permalink
- Report Inappropriate Content
Expression Error
Hello All,
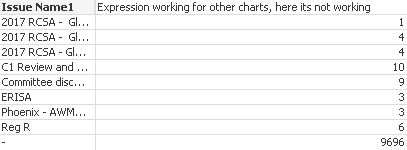
Below expression working for other charts, for attached QVW chart its not working.
please help me know what was the wrong im doing
Thanks in Advance
Niranjan Powar
- « Previous Replies
-
- 1
- 2
- Next Replies »
Accepted Solutions
- Mark as New
- Bookmark
- Subscribe
- Mute
- Subscribe to RSS Feed
- Permalink
- Report Inappropriate Content
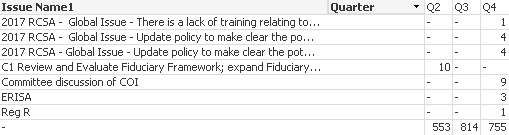
your Expression Count( {<[Issue Creation Date]={">=$(=vLast3Quarter) <=$(=vYourMaxDate)"}>} [Issue ID]) works in the Chart
I have dimensions Issue Name1 and Quarter and your Expression!
when I select 10/12/2018 I get this Chart which is correct, as theere are NO data in 2018 with an other Issue Name1
please look at your raw data for 2018 that there is no other data

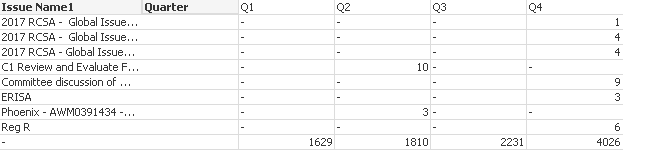
when I select 11/1/2017 I get this Chart
- Mark as New
- Bookmark
- Subscribe
- Mute
- Subscribe to RSS Feed
- Permalink
- Report Inappropriate Content
your variable vLast2Quarter has en empty line before definition
delete the first row and it works

- Mark as New
- Bookmark
- Subscribe
- Mute
- Subscribe to RSS Feed
- Permalink
- Report Inappropriate Content
Thanks for your reply, I have removed the extra space still its not working for me
- Mark as New
- Bookmark
- Subscribe
- Mute
- Subscribe to RSS Feed
- Permalink
- Report Inappropriate Content
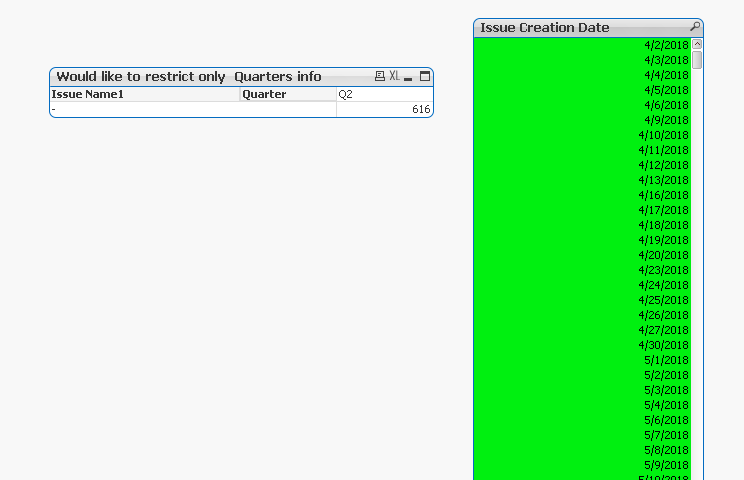
what is your expected Output? can you explain?
using your qvw I see that in the daterange 4/1/2018 to 7/1/2018 there are NO Issue Name 1 (only nulls)
in total we have 616 (distinct 403)

- Mark as New
- Bookmark
- Subscribe
- Mute
- Subscribe to RSS Feed
- Permalink
- Report Inappropriate Content
Could you please check another chart with simple expression im getting the data.
On Second chart data im expecting on first chart.
- Mark as New
- Bookmark
- Subscribe
- Mute
- Subscribe to RSS Feed
- Permalink
- Report Inappropriate Content
the second Chart Shows all data over all years while the first Chart only Shows the last quarter
when you restrict your Issue Creation Date to 4/1/2018 to 7/1/2018 you get the same results
so do you want to show same results in both Charts? right now you compare different!
first Chart without date restriction
- Mark as New
- Bookmark
- Subscribe
- Mute
- Subscribe to RSS Feed
- Permalink
- Report Inappropriate Content
Based on current selections i wast to display the data on chart current 3 Quarters
- Mark as New
- Bookmark
- Subscribe
- Mute
- Subscribe to RSS Feed
- Permalink
- Report Inappropriate Content
your variables vLast3Quartal and vLast2Quartal selects 1 quarter
your Expression allows only the data from 1 quarter,
now you say that you want 3 quarters?
so can you explain more in Detail how the final Chart should Show?
you select a date from [Issue Creation Date] and then the previous 3 quartals
should be shown?
- Mark as New
- Bookmark
- Subscribe
- Mute
- Subscribe to RSS Feed
- Permalink
- Report Inappropriate Content
i have created the current Quarter variable and below expression gives me 3Quarters information.
On Dimentions column i can see blank data,please help me any issue with my dimention
Count( {<[Issue Creation Date]={">=$(=vLast3Quarter) <=$(=vYourMaxDate)"}>} [Issue ID])
- Mark as New
- Bookmark
- Subscribe
- Mute
- Subscribe to RSS Feed
- Permalink
- Report Inappropriate Content
your Expression Count( {<[Issue Creation Date]={">=$(=vLast3Quarter) <=$(=vYourMaxDate)"}>} [Issue ID]) works in the Chart
I have dimensions Issue Name1 and Quarter and your Expression!
when I select 10/12/2018 I get this Chart which is correct, as theere are NO data in 2018 with an other Issue Name1
please look at your raw data for 2018 that there is no other data
when I select 11/1/2017 I get this Chart
- « Previous Replies
-
- 1
- 2
- Next Replies »