Unlock a world of possibilities! Login now and discover the exclusive benefits awaiting you.
- Qlik Community
- :
- All Forums
- :
- QlikView App Dev
- :
- Re: Expression Selection Issue
- Subscribe to RSS Feed
- Mark Topic as New
- Mark Topic as Read
- Float this Topic for Current User
- Bookmark
- Subscribe
- Mute
- Printer Friendly Page
- Mark as New
- Bookmark
- Subscribe
- Mute
- Subscribe to RSS Feed
- Permalink
- Report Inappropriate Content
Expression Selection Issue
What I'm trying to do is be able to select one piece of data in my displayed table and get only one block of data returned, or displayed, without making separate list boxes for each expression. Anyone have a suggestion?
Accepted Solutions
- Mark as New
- Bookmark
- Subscribe
- Mute
- Subscribe to RSS Feed
- Permalink
- Report Inappropriate Content
Try using the CrossTable() load:
CrossTable(Company, Value, 2)
LOAD [Top Level Criteria],
[Sublevel Criteria],
[Company 1],
[Company 2],
[Company 3],
[Company 4],
[Company 5],
[Company 6],
[Company 7],
[Company 8],
[Company 9],
[Company 10],
[Company 11]
FROM
[Numeric Translation (Scratch).xlsx]
(ooxml, embedded labels, table is [Numeric Translation]);
CrossTable(Alt, Value2)
LOAD [Top Level Criteria],
[Alt 1],
[Alt 2],
[Alt 3],
[Alt 4],
[Alt 5],
[Alt 6],
[Alt 7],
[Alt 8],
[Alt 9],
[Alt 10],
[Alt 11]
FROM
[Top Level Roll-Up (Scratch).xlsx]
(ooxml, embedded labels, table is [Top Level Roll-up]);
- Mark as New
- Bookmark
- Subscribe
- Mute
- Subscribe to RSS Feed
- Permalink
- Report Inappropriate Content
Not sure what you are trying to see here? Can you may be elaborate?
- Mark as New
- Bookmark
- Subscribe
- Mute
- Subscribe to RSS Feed
- Permalink
- Report Inappropriate Content
May be you can create one more table box instead of chart, and put all your fields into that.
If you select the value in the expression, it will filter the dimension only, not the expression value..
- Mark as New
- Bookmark
- Subscribe
- Mute
- Subscribe to RSS Feed
- Permalink
- Report Inappropriate Content
Can you please elaborate the requirement ? do you want ignore one piece of selections ?
- Mark as New
- Bookmark
- Subscribe
- Mute
- Subscribe to RSS Feed
- Permalink
- Report Inappropriate Content
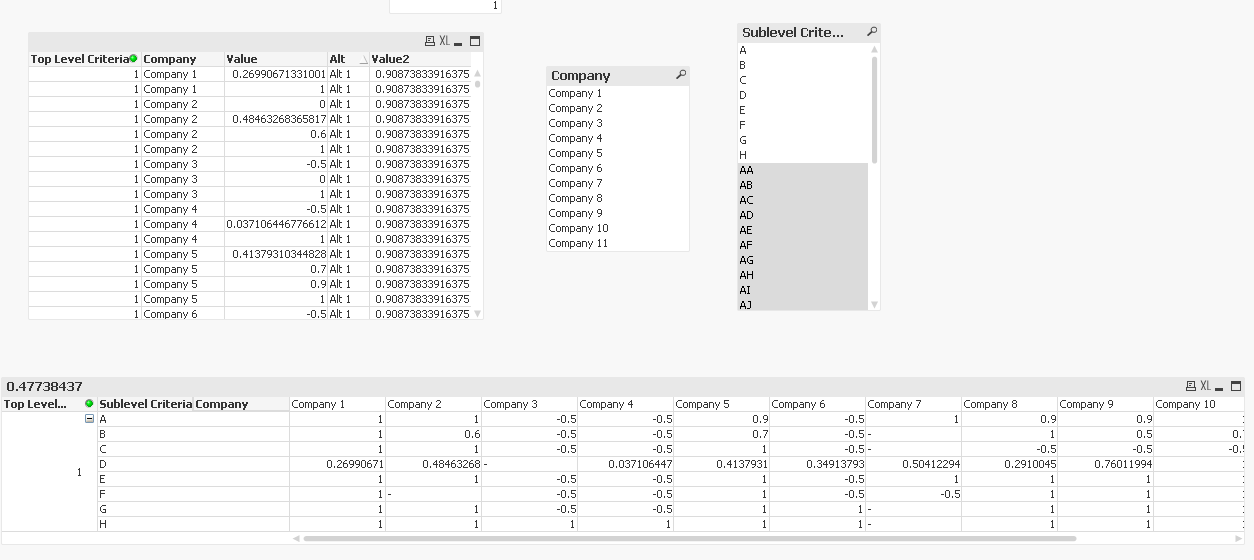
What I'm trying to do is get this displayed data as shown:
| Top Level Criteria | Sublevel Criteria | Company 1 | Company 2 | Company 3 | Company 4 | Company 5 | Company 6 | Company 7 | Company 8 | Company 9 | Company 10 | Company 11 |
| 1 | A | 1.00 | 1.00 | -0.50 | -0.50 | 0.90 | -0.50 | 1.00 | 0.90 | 0.90 | 1.00 | 1.00 |
To look like this after selecting the specific company values from above:
| Top Level Criteria | Sublevel Criteria | Company 2 | Company 11 |
| 1 | A | 1.00 | 1.00 |
What happens now is that the specific company values cannot be selected individually, while hiding the remaining values. Any help would be greatly appreciated.
- Mark as New
- Bookmark
- Subscribe
- Mute
- Subscribe to RSS Feed
- Permalink
- Report Inappropriate Content
Try using the CrossTable() load:
CrossTable(Company, Value, 2)
LOAD [Top Level Criteria],
[Sublevel Criteria],
[Company 1],
[Company 2],
[Company 3],
[Company 4],
[Company 5],
[Company 6],
[Company 7],
[Company 8],
[Company 9],
[Company 10],
[Company 11]
FROM
[Numeric Translation (Scratch).xlsx]
(ooxml, embedded labels, table is [Numeric Translation]);
CrossTable(Alt, Value2)
LOAD [Top Level Criteria],
[Alt 1],
[Alt 2],
[Alt 3],
[Alt 4],
[Alt 5],
[Alt 6],
[Alt 7],
[Alt 8],
[Alt 9],
[Alt 10],
[Alt 11]
FROM
[Top Level Roll-Up (Scratch).xlsx]
(ooxml, embedded labels, table is [Top Level Roll-up]);
- Mark as New
- Bookmark
- Subscribe
- Mute
- Subscribe to RSS Feed
- Permalink
- Report Inappropriate Content
The cross table load is helpful, but it still has additional values that the customer would not like to see such as the multiple repeating values in the table box display. The closest example that I think I could use is the pivot table example you have in the file. Thanks for the help! 
- Mark as New
- Bookmark
- Subscribe
- Mute
- Subscribe to RSS Feed
- Permalink
- Report Inappropriate Content
No problem at all