Unlock a world of possibilities! Login now and discover the exclusive benefits awaiting you.
- Qlik Community
- :
- All Forums
- :
- QlikView App Dev
- :
- Re: Expression for replacing the label for a count...
- Subscribe to RSS Feed
- Mark Topic as New
- Mark Topic as Read
- Float this Topic for Current User
- Bookmark
- Subscribe
- Mute
- Printer Friendly Page
- Mark as New
- Bookmark
- Subscribe
- Mute
- Subscribe to RSS Feed
- Permalink
- Report Inappropriate Content
Expression for replacing the label for a count of Null values
I have a pie chart object that counts the number of statuses based on the data below. There are "null" values and in Qlik, it label's it "-". How can I update the label of null counts to a different label, like "Other"?
| Total Count | |
|---|---|
| 35 | |
| Green | 13 |
| Yellow | 1 |
| Red | 2 |
| - | 19 |
I would like to know how to write the expression for the replacement of the "-" to "Other" and where to put it via the UI (via chart properties) as well as how to write the expression to add to the script.
Thanks!
Trista
Accepted Solutions
- Mark as New
- Bookmark
- Subscribe
- Mute
- Subscribe to RSS Feed
- Permalink
- Report Inappropriate Content
In presentation tab, you can change symbol of Null.
- Mark as New
- Bookmark
- Subscribe
- Mute
- Subscribe to RSS Feed
- Permalink
- Report Inappropriate Content
In presentation tab, you can change symbol of Null.
- Mark as New
- Bookmark
- Subscribe
- Mute
- Subscribe to RSS Feed
- Permalink
- Report Inappropriate Content
In the script If you want to give specific name to Null values you are loading from your source, you should use this before the load -
NullAsValue *; //* means all the fields, you can use it for specific fields as well by writing field names here.
Set NullValue = 'IamNull';
This won't work for the nulls generated through joins during runtime while visualizing charts, for those kinda null you need to use Null symbol available in Presentation tab.
- Mark as New
- Bookmark
- Subscribe
- Mute
- Subscribe to RSS Feed
- Permalink
- Report Inappropriate Content
NullValue also admits to pick the fields if you don't want to load all nulls as value:
Set NullValue = 'Other';
NullAsValue ColorField;
There is also the option to check while loading the table:
LOAD If(IsNull(ColorField), 'Other', ColorField) as ColorField,
...
- Mark as New
- Bookmark
- Subscribe
- Mute
- Subscribe to RSS Feed
- Permalink
- Report Inappropriate Content
U can write an if condition to replace the null value with others If(len(fieldname)=0,'Others',Fieldname) as a calculated Dimension Hope this helps. If not please share a sample with the expected output. Thanks
- Mark as New
- Bookmark
- Subscribe
- Mute
- Subscribe to RSS Feed
- Permalink
- Report Inappropriate Content
can you write it with load example?
- Mark as New
- Bookmark
- Subscribe
- Mute
- Subscribe to RSS Feed
- Permalink
- Report Inappropriate Content
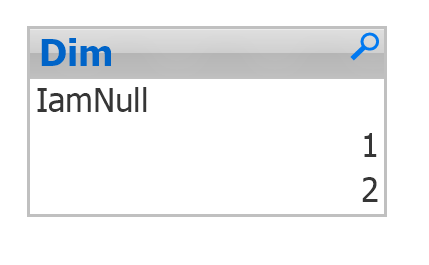
Like this -
Set Nullinterpret = '%'; //In real scenario it won't be needed, here I am forcing '%' symbol to be interpreted as null;
NullasValue Dim;
Set NullValue = 'IamNull';
Dim:
LOAD * Inline [
Dim
1
2
%
];
- Mark as New
- Bookmark
- Subscribe
- Mute
- Subscribe to RSS Feed
- Permalink
- Report Inappropriate Content
Thanks Digvijay!
Changing the Null Value via the Presentation did change the value in Qlik, but now if I copy this table from Qlik into Excel (Copy to Clipboard > Full Table), the "Other" label does not copy/paste. Instead, it's just <blank>. I'm creating a macro to copy over this table to Excel. Is there another way to ensure I don't lose this label? Or is it better to just script it?
| Total Count | |
|---|---|
| 35 | |
| Green | 13 |
| Yellow | 1 |
| Red | 2 |
| Other | 19 |
- Mark as New
- Bookmark
- Subscribe
- Mute
- Subscribe to RSS Feed
- Permalink
- Report Inappropriate Content
Not sure about export behavior but I prefer scripting it for specific field. But ensure its not causing any impact on null related codes and expressions.