Unlock a world of possibilities! Login now and discover the exclusive benefits awaiting you.
- Qlik Community
- :
- All Forums
- :
- QlikView App Dev
- :
- Expression help please
- Subscribe to RSS Feed
- Mark Topic as New
- Mark Topic as Read
- Float this Topic for Current User
- Bookmark
- Subscribe
- Mute
- Printer Friendly Page
- Mark as New
- Bookmark
- Subscribe
- Mute
- Subscribe to RSS Feed
- Permalink
- Report Inappropriate Content
Expression help please
Hi - The below expression works great, however, I need to make it return values only if "SpLimitLowValue" is > 0. Nothing I try is working. Please help!
Count({<ActualNumeric={">0"}>} If(ActualNumeric<SpLimitLowValue, ActualNumeric) or If(ActualNumeric>SpLimitUpperValue, ActualNumeric))
/
(Count({<ActualNumeric={">0"}>} If(ActualNumeric>SpLimitLowValue and ActualNumeric<SpLimitUpperValue, ActualNumeric))+
Count({<ActualNumeric={">0"}>} If(ActualNumeric<SpLimitLowValue, ActualNumeric) or If(ActualNumeric>SpLimitUpperValue, ActualNumeric)))
Thank you!
- « Previous Replies
-
- 1
- 2
- Next Replies »
Accepted Solutions
- Mark as New
- Bookmark
- Subscribe
- Mute
- Subscribe to RSS Feed
- Permalink
- Report Inappropriate Content
You mean like this?
Count({<ActualNumeric={">0"}>-<SpLimitLowValue={0}>-<SpLimitUpperValue={0}>} If(ActualNumeric<SpLimitLowValue, ActualNumeric) or If(ActualNumeric>SpLimitUpperValue, ActualNumeric))
Or this?
Count({<ActualNumeric={">0"}>-<SpLimitLowValue={0},SpLimitUpperValue={0}>} If(ActualNumeric<SpLimitLowValue, ActualNumeric) or If(ActualNumeric>SpLimitUpperValue, ActualNumeric))
- Mark as New
- Bookmark
- Subscribe
- Mute
- Subscribe to RSS Feed
- Permalink
- Report Inappropriate Content
Try this one:
Count({<ActualNumeric={">0"}>} If(ActualNumeric<SpLimitLowValue or ActualNumeric>SpLimitUpperValue, ActualNumeric))
/
(Count({<ActualNumeric={">0"}>} If(ActualNumeric>SpLimitLowValue and ActualNumeric<SpLimitUpperValue, ActualNumeric))+
Count({<ActualNumeric={">0"}>} If(ActualNumeric<SpLimitLowValue or ActualNumeric>SpLimitUpperValue, ActualNumeric)))
talk is cheap, supply exceeds demand
- Mark as New
- Bookmark
- Subscribe
- Mute
- Subscribe to RSS Feed
- Permalink
- Report Inappropriate Content
That gives me the same result. The expression I have works great, I just need to add the equivalent of a Count If statement to exclude any result if the "SpLimitLowValue" is 0.
I'm calculating the percentage of tests that fall within certain ranges. The solid red bars below are showing 100% of tests are out of range, but only because the specs are 0 for those ranges - I need to eliminate those. "SpLimitLowValue" is the lowest spec, so red should only return values if that field has a value greater than 0.
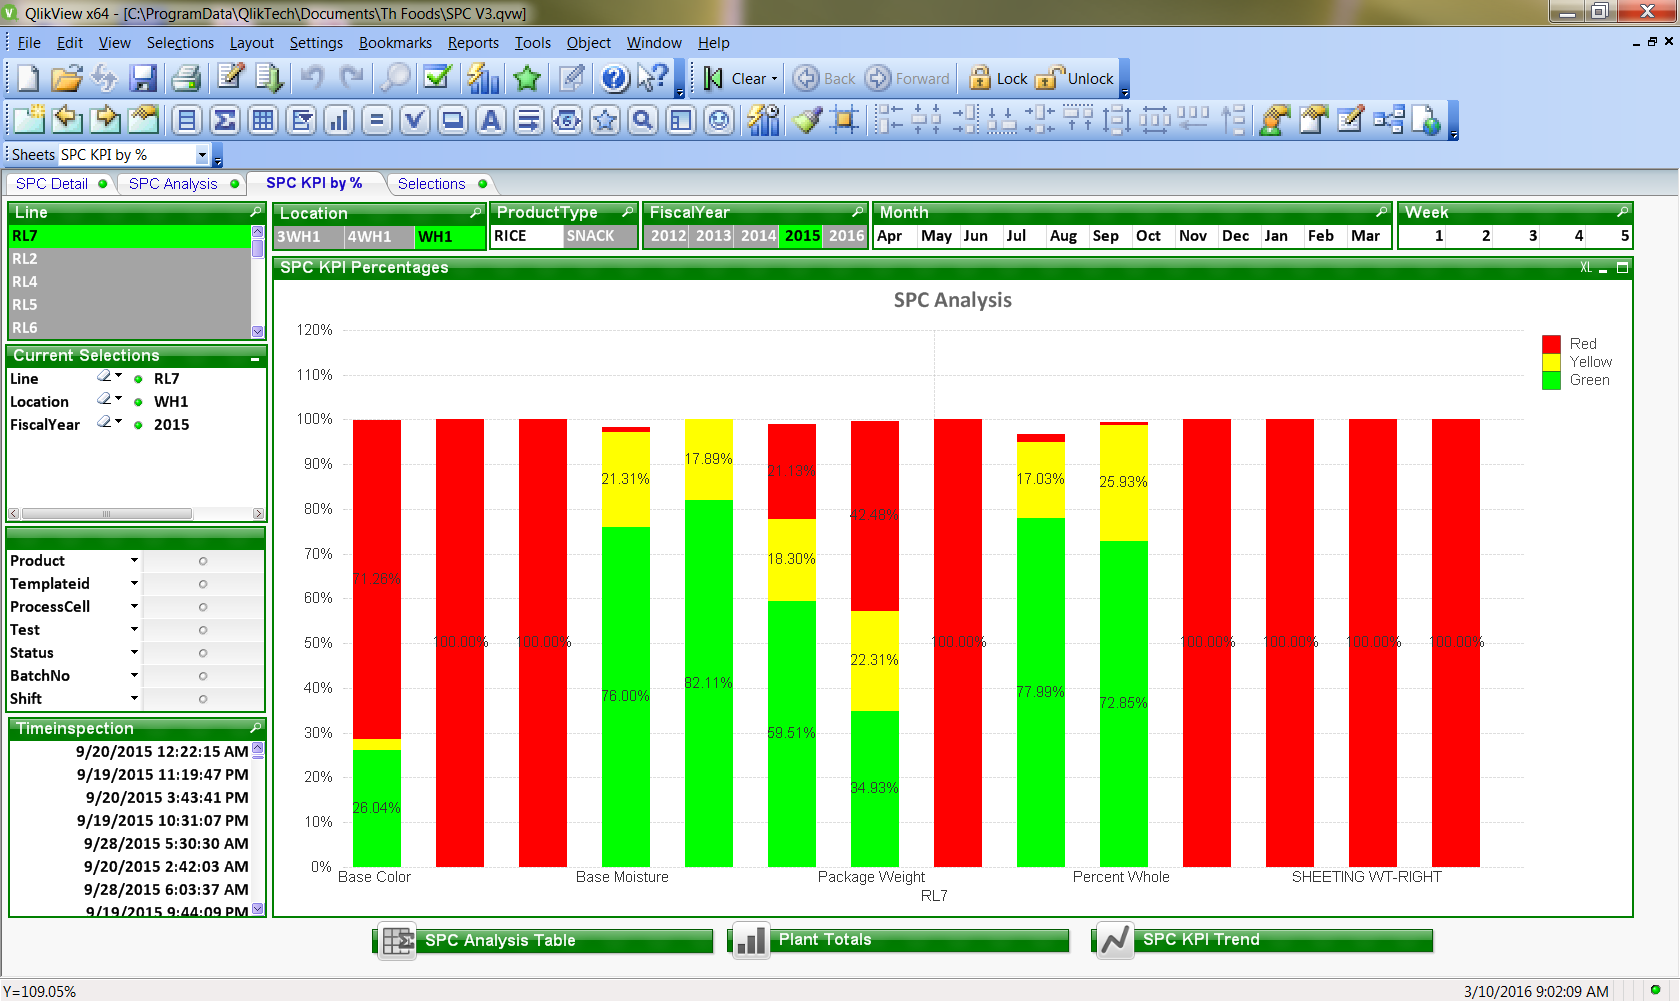
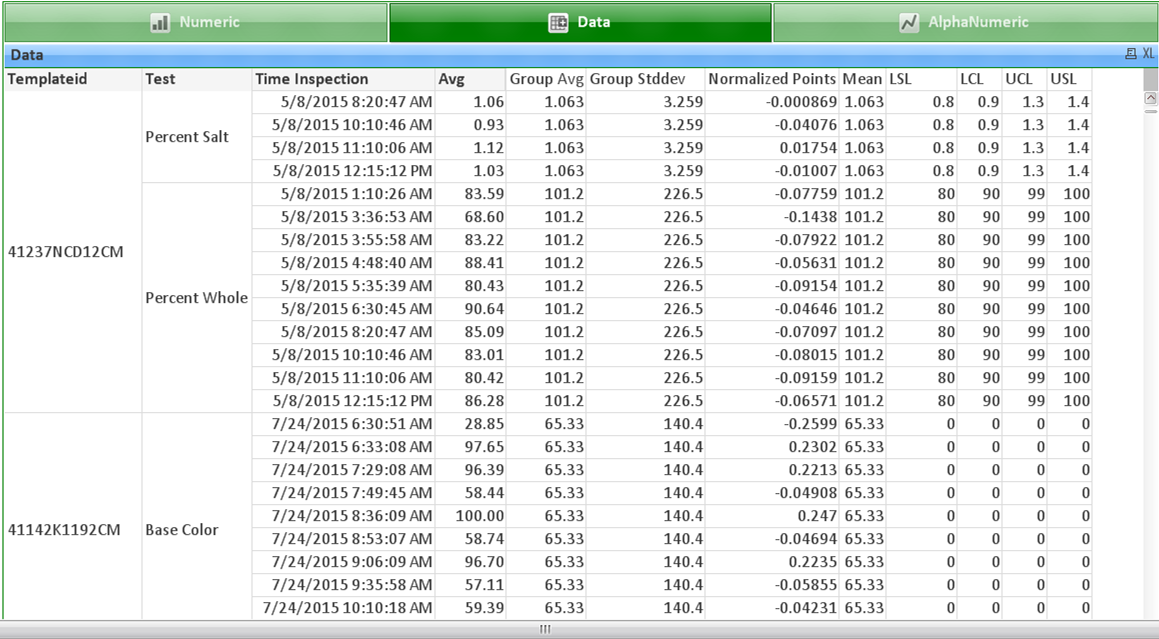
This is the data below. The "LSL" is the "SpLimitLowValue". In this example, the specs are 0 for Base Color, so no values should be returned for Base Color in the bar chart above. The "Avg" is the "ActualNumeric" value that is being measured.
I hope I explained that clearly.
Thank you for your help!!
- Mark as New
- Bookmark
- Subscribe
- Mute
- Subscribe to RSS Feed
- Permalink
- Report Inappropriate Content
So you just want to exclude rows where SpLimitLowValue is 0?
You should be able to exclude them in the set analysis like this:
Count({<ActualNumeric={">0"}>-<SpLimitLowValue={0}>} If(ActualNumeric<SpLimitLowValue, ActualNumeric) or If(ActualNumeric>SpLimitUpperValue, ActualNumeric))
- Mark as New
- Bookmark
- Subscribe
- Mute
- Subscribe to RSS Feed
- Permalink
- Report Inappropriate Content
Yes – that’s perfect – thank you!
I also have some specs like this:
Time Inspection
Avg
LSL
LCL
UCL
USL
5/21/2015 8:35
6.01
0
2
6
8
5/21/2015 9:24
2.66
0
2
6
8
USL is SpLimitUpperValue
What is the correct syntax to add a parameter of “and >-<SpLimitUpperValue=>}”? Count({<ActualNumeric={">0"}>-<SpLimitLowValue=>}
If(ActualNumeric<SpLimitLowValue, ActualNumeric) or If(ActualNumeric>SpLimitUpperValue, ActualNumeric))
I keep trying to different ways to add it, but it doesn’t work. Thank you!
- Mark as New
- Bookmark
- Subscribe
- Mute
- Subscribe to RSS Feed
- Permalink
- Report Inappropriate Content
You mean like this?
Count({<ActualNumeric={">0"}>-<SpLimitLowValue={0}>-<SpLimitUpperValue={0}>} If(ActualNumeric<SpLimitLowValue, ActualNumeric) or If(ActualNumeric>SpLimitUpperValue, ActualNumeric))
Or this?
Count({<ActualNumeric={">0"}>-<SpLimitLowValue={0},SpLimitUpperValue={0}>} If(ActualNumeric<SpLimitLowValue, ActualNumeric) or If(ActualNumeric>SpLimitUpperValue, ActualNumeric))
- Mark as New
- Bookmark
- Subscribe
- Mute
- Subscribe to RSS Feed
- Permalink
- Report Inappropriate Content
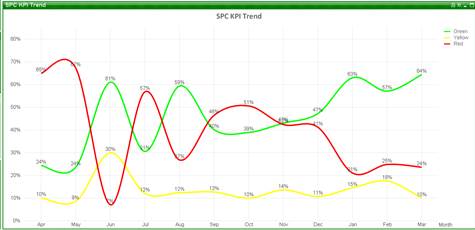
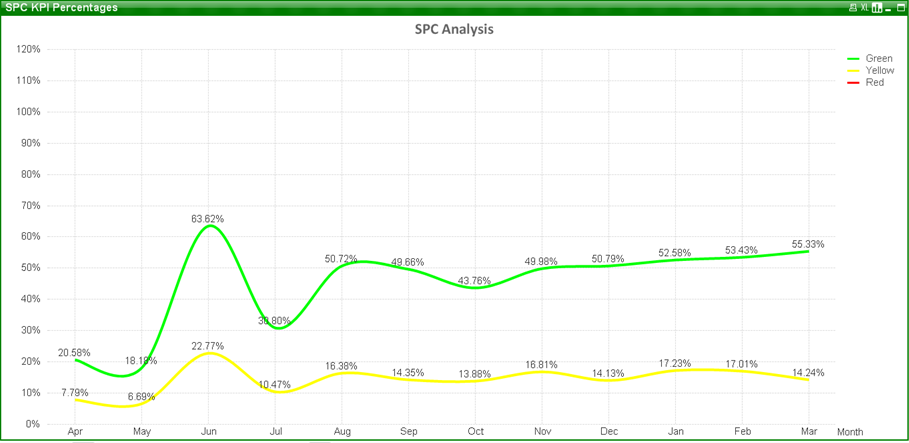
Yes! Thank you!! Shouldn’t the same expression work for the trend line chart?
When I apply the same expression, the red trend line disappears:
Thanks,
Lee Van Scoy
TH Foods, Inc.
Operations Research Analyst
Phone: 815-639-3395
Cell: 779-888-0968
This email contains company/employee specific, confidential and/or proprietary information intended only for the individual(s) named above. If you have received this message in error, destroy this original message and all copies. Please contact the Sender to advise of the incident.
- Mark as New
- Bookmark
- Subscribe
- Mute
- Subscribe to RSS Feed
- Permalink
- Report Inappropriate Content
It should work on the line chart the same way. Try putting a fast change on the bar chart to turn it into a line chart and see if the same thing happens. That should help you figure out if the problem is with something on the line chart that you're trying to change.
- Mark as New
- Bookmark
- Subscribe
- Mute
- Subscribe to RSS Feed
- Permalink
- Report Inappropriate Content
Thank you!
- Mark as New
- Bookmark
- Subscribe
- Mute
- Subscribe to RSS Feed
- Permalink
- Report Inappropriate Content
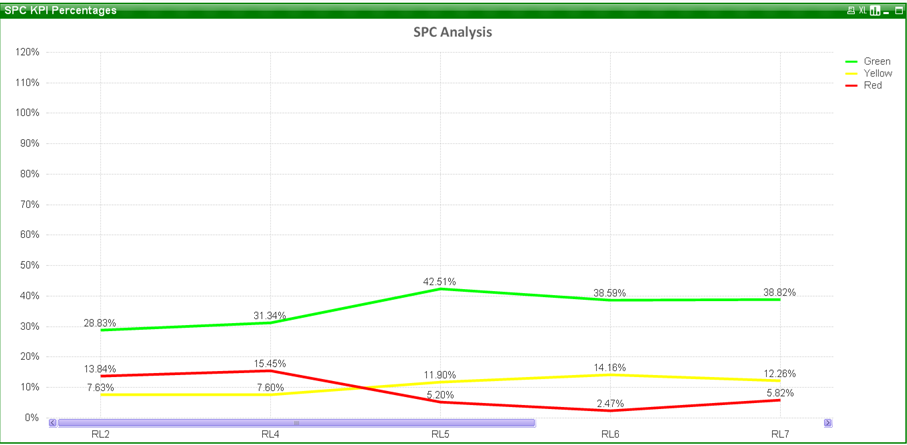
When I use the fast change it works just fine changing the data into a line chart:
But, I need to change the dimension to "Month" for the line chart, and no matter what I try, I lose the red trend line:
- « Previous Replies
-
- 1
- 2
- Next Replies »