Unlock a world of possibilities! Login now and discover the exclusive benefits awaiting you.
- Qlik Community
- :
- All Forums
- :
- QlikView App Dev
- :
- Expression ignores Dimension but is still limited ...
- Subscribe to RSS Feed
- Mark Topic as New
- Mark Topic as Read
- Float this Topic for Current User
- Bookmark
- Subscribe
- Mute
- Printer Friendly Page
- Mark as New
- Bookmark
- Subscribe
- Mute
- Subscribe to RSS Feed
- Permalink
- Report Inappropriate Content
Expression ignores Dimension but is still limited by Dimension
I have what I think is a very complicated question.
I have a Chart that has 1 Dimension and 3 Expressions and the user can make Year and Month selections.
Dimension: Year Month (YYYYMM)
Expression 1: Inventory $
Expression 2: Turns $ (Sale Cost / Inventory $)
Expression 3: Sales $
What I’m trying to do is calculate annualized (current Year to Date, less than equal to the Dimension) Turns $ for each row (1 row for each month), but instead what I’m getting is only one month Turns $ per row.
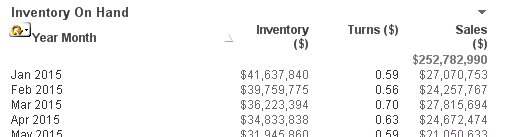
When I try to use TOTAL I get the max Turns $ for the Year selected for each row rather than the annualized (current Year to Date, less than equal to the Dimension) Turns $.
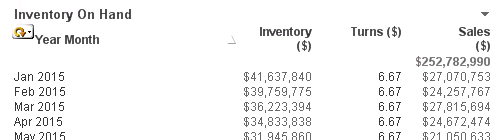
When I change the Dimension to show by Product or by Company Name it calculates correctly because there is no time restriction so I know the base formula is correct, I just can't figure out how to calculate using time (Year to Date) and ignore the Dimension while still limiting the data to the Dimension.
This is my Expression without TOTAL included.
((Sum({<Year = {'$(=max(Year))'},Month = {'<=$(=max(Month))'}>} $(eCost)))
* (if([Year]=[vThisYear], 252, Sum({<Year ={'$(=max(Year))'} ,Month = >} CAL_BUSINESS_DAY_IND)) / Sum({<Year = {'$(=max(Year))'},Month = {'<=$(=max(Month))'}>} CAL_BUSINESS_DAY_IND)))
/
(Sum({<Year = {'$(=max(Year))'},Month = {'<=$(=max(Month))'} >} INV_ONHND_COST)
/count({<Year = {'$(=max(Year))'},Month = {'<=$(=max(Month))'} >} distinct [Inv Snapshot Date]))
Any suggestions of any kind would be appreciated.