Unlock a world of possibilities! Login now and discover the exclusive benefits awaiting you.
- Qlik Community
- :
- All Forums
- :
- QlikView App Dev
- :
- Expression not returning a value.
- Subscribe to RSS Feed
- Mark Topic as New
- Mark Topic as Read
- Float this Topic for Current User
- Bookmark
- Subscribe
- Mute
- Printer Friendly Page
- Mark as New
- Bookmark
- Subscribe
- Mute
- Subscribe to RSS Feed
- Permalink
- Report Inappropriate Content
Expression not returning a value.
I have a chart that contains the following expresisions
PO Lines = sum (POHeader.Count)
Catolog Lines = COUNT({$<[REQLine.CatalogType]={"CATALOG","NON-IPROC","EXTERNAL"}>}[REQLine.CatalogType])
%Lines Automated = COUNT({$<[REQLine.CatalogType]={"CATALOG","NON-IPROC","EXTERNAL"}>}[REQLine.CatalogType])/sum (POHeader.Count)
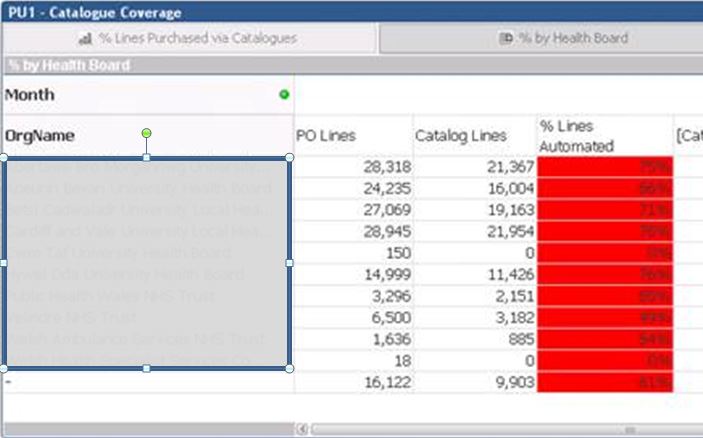
IT is not clear to see from the uploaded image but the % Lines are all correct . However when I remove PO Lines and CAtaolg Lines functions, the % Lines Automated Expression no longer provides a value for records that have 0 catalog Lines. Can anyone shed any light on this behaviour?
Please note I have blanked out the Org Name Values for Confidentiality,
Thanks,
Accepted Solutions
- Mark as New
- Bookmark
- Subscribe
- Mute
- Subscribe to RSS Feed
- Permalink
- Report Inappropriate Content
Hi Rob, in presentation tab, try uncheck 'Supress zero values'.
When you have the expressions it's drawing the row beacuse there is at least one expression not equal to 0, when you left only the percentage, all rows that returns 0 are supressed.
- Mark as New
- Bookmark
- Subscribe
- Mute
- Subscribe to RSS Feed
- Permalink
- Report Inappropriate Content
Try disabling the Suppress Zero-Values option on the Presentation tab.
talk is cheap, supply exceeds demand
- Mark as New
- Bookmark
- Subscribe
- Mute
- Subscribe to RSS Feed
- Permalink
- Report Inappropriate Content
Thanks both, I must master the myriad of presentation options. I