Unlock a world of possibilities! Login now and discover the exclusive benefits awaiting you.
- Qlik Community
- :
- All Forums
- :
- QlikView App Dev
- :
- Re: Expression to count no of rows with same key v...
- Subscribe to RSS Feed
- Mark Topic as New
- Mark Topic as Read
- Float this Topic for Current User
- Bookmark
- Subscribe
- Mute
- Printer Friendly Page
- Mark as New
- Bookmark
- Subscribe
- Mute
- Subscribe to RSS Feed
- Permalink
- Report Inappropriate Content
Expression to count no of rows with same key value
I am trying to plot a scatter chart.
Data:
| Country | Sales | Profit | List Price |
|---|---|---|---|
| USA | 200 | 30 | 300 |
| USA | 500 | 40 | 400 |
| South Africa | 400 | 50 | 500 |
| India | 200 | 20 | 200 |
| Thailand | 50 | 5 | 50 |
I am plotting scatter plot of sales vs Profit with dimension Country. Now I need to have a bubble size of USA to be shown big as I have 2 records for USA. But for others it should be of same size smaller to USA.
I need to calculate an expression, which would give me count of rows 2 for USA and 1 for others so that I can vary my bubble size. Can you help me how to calculate this expression?
- Tags:
- new_to_qlikview
- Mark as New
- Bookmark
- Subscribe
- Mute
- Subscribe to RSS Feed
- Permalink
- Report Inappropriate Content
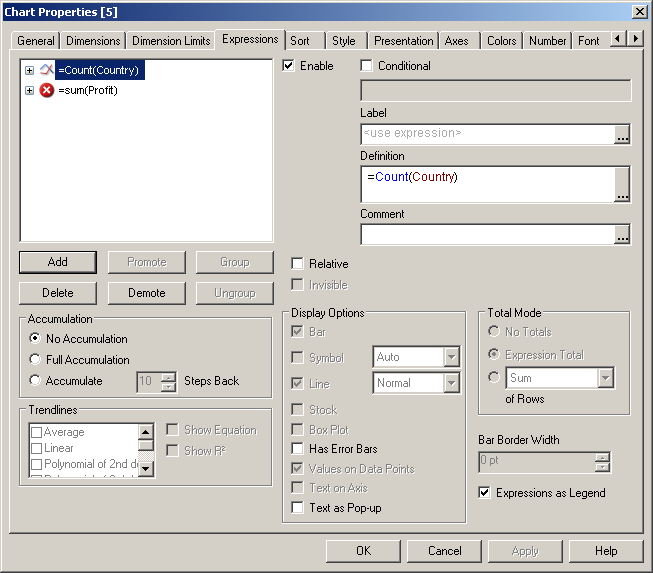
Count(country) is that what your mean?
- Mark as New
- Bookmark
- Subscribe
- Mute
- Subscribe to RSS Feed
- Permalink
- Report Inappropriate Content
Hi Pinaki,
Please check the attached app.
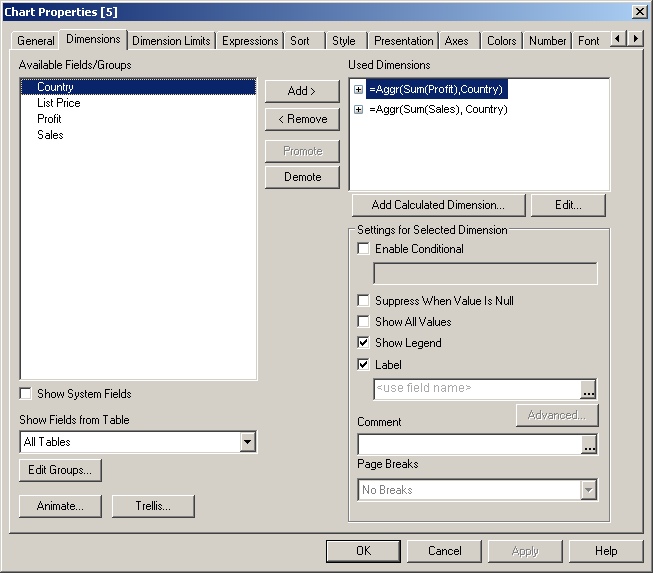
You would need to have calculated dimensions for the chart to plot across the Sales and Profit.
The count of country would be the expression and would determine the size of the bubble.
Hope this helps.
Regards,
SK
- Mark as New
- Bookmark
- Subscribe
- Mute
- Subscribe to RSS Feed
- Permalink
- Report Inappropriate Content
Yes
- Mark as New
- Bookmark
- Subscribe
- Mute
- Subscribe to RSS Feed
- Permalink
- Report Inappropriate Content
I am using Personal edition. hence cant open this file. can u please give me the formula?
- Mark as New
- Bookmark
- Subscribe
- Mute
- Subscribe to RSS Feed
- Permalink
- Report Inappropriate Content
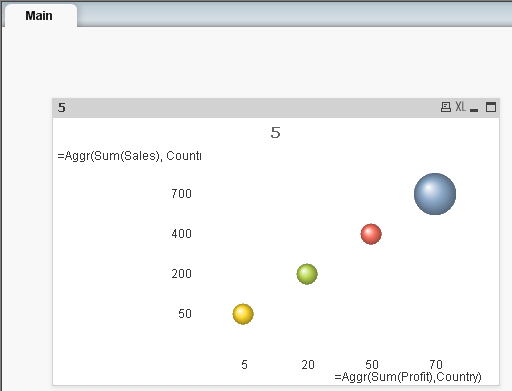
Does that not show you what you want? the yellow bubble (USA) is twice the size.
- Mark as New
- Bookmark
- Subscribe
- Mute
- Subscribe to RSS Feed
- Permalink
- Report Inappropriate Content
Sorry Linus. I am not able to open your QVW file.
- Mark as New
- Bookmark
- Subscribe
- Mute
- Subscribe to RSS Feed
- Permalink
- Report Inappropriate Content
- Mark as New
- Bookmark
- Subscribe
- Mute
- Subscribe to RSS Feed
- Permalink
- Report Inappropriate Content
Hi Pinaki,
Does the above solution work for you?
Regards,
SK