Unlock a world of possibilities! Login now and discover the exclusive benefits awaiting you.
- Qlik Community
- :
- All Forums
- :
- QlikView App Dev
- :
- Expression values not displayed in block charts
- Subscribe to RSS Feed
- Mark Topic as New
- Mark Topic as Read
- Float this Topic for Current User
- Bookmark
- Subscribe
- Mute
- Printer Friendly Page
- Mark as New
- Bookmark
- Subscribe
- Mute
- Subscribe to RSS Feed
- Permalink
- Report Inappropriate Content
Expression values not displayed in block charts
Hi,
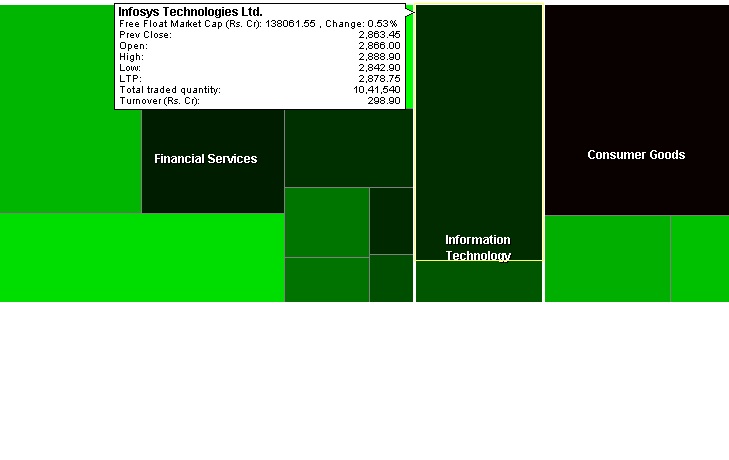
I have created a block chart which has a single variable called "company" and I have defined 2 expessions namely sum(sales) and sum(profit). The block chart gets generated but when I point a cursor to an area in the block chart, I am able to see only two fields in the pop up , the company name and the sales value with the following format "company name = "+the company name followed by "sales = "+ the approriate sales value. I am not able to see the value of profit. How do I ensure that I get the third value in the pop up?
I have seen a live example in which all the variables are displayed. Please find it in the image pasted below. How do I create something like the chart in the pasted attachment. Can someone please advise?
Regards
Sachin

- Mark as New
- Bookmark
- Subscribe
- Mute
- Subscribe to RSS Feed
- Permalink
- Report Inappropriate Content
Hi
Check out the Presentation tab and make sure the correct number of visible levels is shown. I do not know if this is the issue, but its worth trying.
I have a block chart with all levels showing. But I cannot get a label to show for all 3 dimensions.
Any ideas?
Regards
- Mark as New
- Bookmark
- Subscribe
- Mute
- Subscribe to RSS Feed
- Permalink
- Report Inappropriate Content
Sachin,
I see from your "Information Technology" label that it is wrapped over two lines. Where do I find the setting that will allow me to do this?