Unlock a world of possibilities! Login now and discover the exclusive benefits awaiting you.
- Qlik Community
- :
- All Forums
- :
- QlikView App Dev
- :
- Re: Extracting number of categories in a chart
- Subscribe to RSS Feed
- Mark Topic as New
- Mark Topic as Read
- Float this Topic for Current User
- Bookmark
- Subscribe
- Mute
- Printer Friendly Page
- Mark as New
- Bookmark
- Subscribe
- Mute
- Subscribe to RSS Feed
- Permalink
- Report Inappropriate Content
Extracting number of categories in a chart
Hi all,
I've been trying for hours now to achieve the following: I have put together a chart with essentially two columns
Col1 Col2 Col3
Key1 A 1
Key2 A 2
Key3 A 3
Key4 B 4
Key5 B 5
Key6 C 6
Col2 is a string, but I need to convert it to a numeric so I can use it in a scatterplot. How can I count the number of unique entries of Col2 in an expression...here the value is 3? Col2 is generated via an expression on its own.
Thanks a lot for your advice,
Florian
Accepted Solutions
- Mark as New
- Bookmark
- Subscribe
- Mute
- Subscribe to RSS Feed
- Permalink
- Report Inappropriate Content
- Mark as New
- Bookmark
- Subscribe
- Mute
- Subscribe to RSS Feed
- Permalink
- Report Inappropriate Content
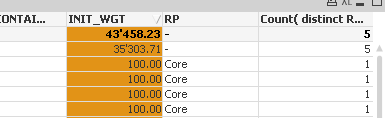
How can I count the number of unique entries of Col2 in an expression...here the value is 3?
May be this
Count(DISTINCT Col2)
Col2 is generated via an expression on its own.
How is Col2 getting generated? If statement? Can you provide the expression and dimensions for your chart?
- Mark as New
- Bookmark
- Subscribe
- Mute
- Subscribe to RSS Feed
- Permalink
- Report Inappropriate Content
Try count(distinct aggr( ...expression_that_calculates_Col2_here..., Col1))
talk is cheap, supply exceeds demand
- Mark as New
- Bookmark
- Subscribe
- Mute
- Subscribe to RSS Feed
- Permalink
- Report Inappropriate Content
Hi Sunny,
I have tried that, but it doesn't seem to work. Col2 can for e.g. have values A-E, so a total of 5. But when I do the count distinct on the above table, I get a 1 back instead of a 3.
Best,
Florian
- Mark as New
- Bookmark
- Subscribe
- Mute
- Subscribe to RSS Feed
- Permalink
- Report Inappropriate Content
How about this:
Count(DISTINCT TOTAL Col2)