Unlock a world of possibilities! Login now and discover the exclusive benefits awaiting you.
- Qlik Community
- :
- All Forums
- :
- QlikView App Dev
- :
- Fast Change Chart Type
- Subscribe to RSS Feed
- Mark Topic as New
- Mark Topic as Read
- Float this Topic for Current User
- Bookmark
- Subscribe
- Mute
- Printer Friendly Page
- Mark as New
- Bookmark
- Subscribe
- Mute
- Subscribe to RSS Feed
- Permalink
- Report Inappropriate Content
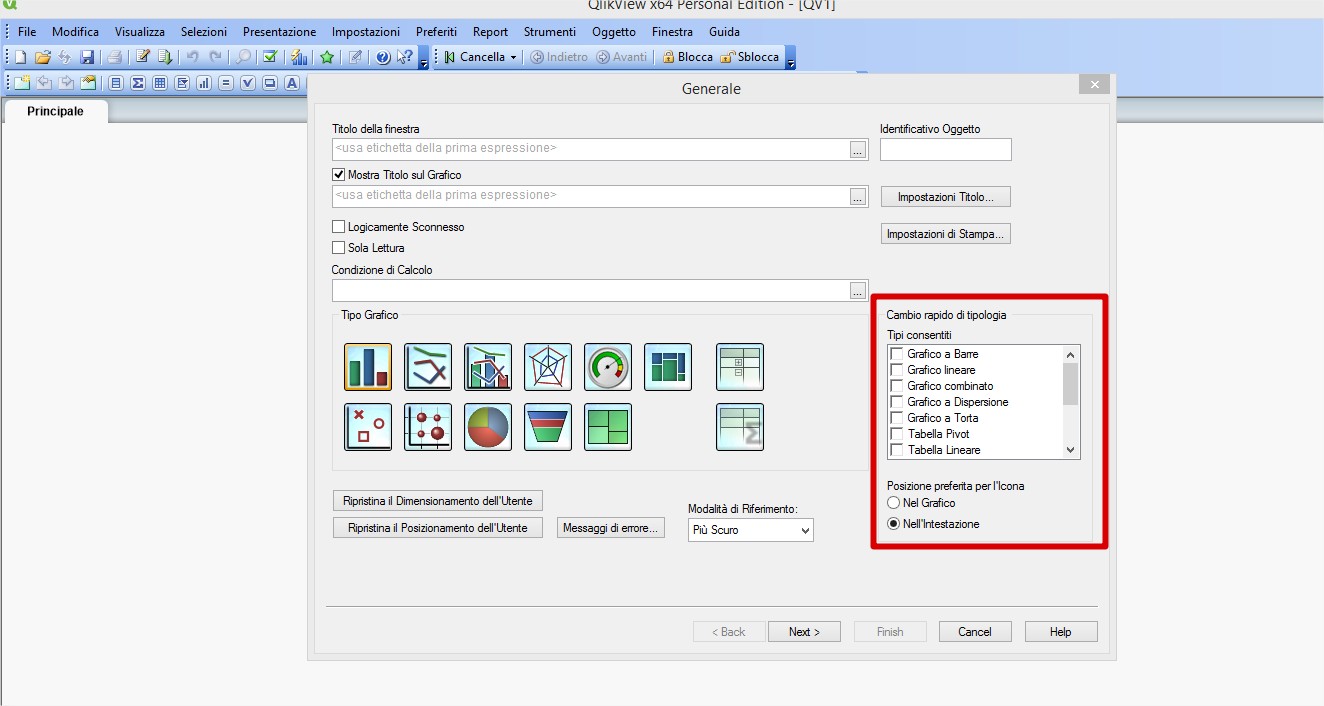
Fast Change Chart Type
I have a pivot table that has two expressions ( Yearly Revenue by Region as well as % of Revenue by Region)
Is it possible to add two different Fast Change Charts: One that will only show the first expression and then one that will only show the second expression?
- Mark as New
- Bookmark
- Subscribe
- Mute
- Subscribe to RSS Feed
- Permalink
- Report Inappropriate Content
I think you need Cyclik group. Look up under Dcument properties- Groups.
You can refer to fillowing post.
- Mark as New
- Bookmark
- Subscribe
- Mute
- Subscribe to RSS Feed
- Permalink
- Report Inappropriate Content
I am actually trying to not group the data. I would like to have one chart type for one expression and one chart type for the other expression while displaying both expression on the pivot table. I was hoping the fast type charts would allow me to do this?
- Mark as New
- Bookmark
- Subscribe
- Mute
- Subscribe to RSS Feed
- Permalink
- Report Inappropriate Content
In the expression panel, you can group two expressions clicking in the "group" button, but doesnt work in pivot tables...
- Mark as New
- Bookmark
- Subscribe
- Mute
- Subscribe to RSS Feed
- Permalink
- Report Inappropriate Content
Hi try this:
- Mark as New
- Bookmark
- Subscribe
- Mute
- Subscribe to RSS Feed
- Permalink
- Report Inappropriate Content
You could do this by hiding one or the other expression depending on chart type... if there were any function that would tell us the chart type, but so far as I know, there isn't.
You could perhaps use three charts with a way of switching between them, such as by putting them in a container.