Unlock a world of possibilities! Login now and discover the exclusive benefits awaiting you.
- Qlik Community
- :
- All Forums
- :
- QlikView App Dev
- :
- Re: File wizard transformation error
- Subscribe to RSS Feed
- Mark Topic as New
- Mark Topic as Read
- Float this Topic for Current User
- Bookmark
- Subscribe
- Mute
- Printer Friendly Page
- Mark as New
- Bookmark
- Subscribe
- Mute
- Subscribe to RSS Feed
- Permalink
- Report Inappropriate Content
File wizard transformation error
Hi,
Can someone please try and help me to work out what's wrong with my script?
I'm having trouble getting the correct sum of forecast and growth value from the data. I think it may have something to do with the way I did the file transformation from in file wizard but I can't work out what went wrong.
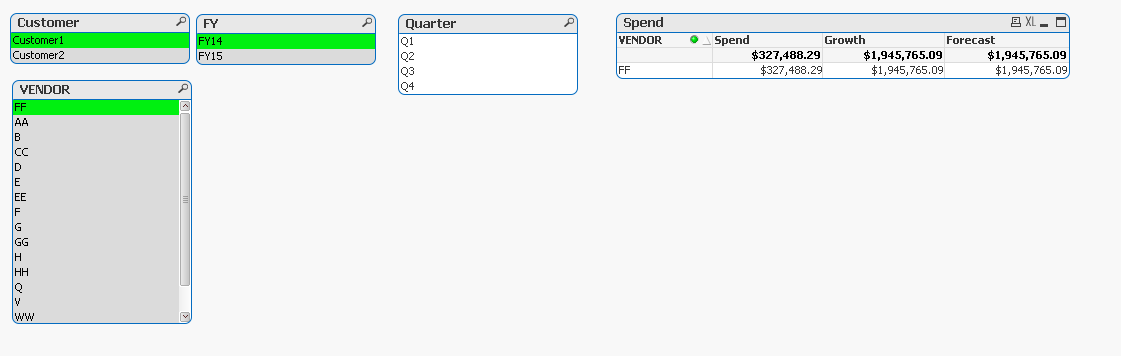
As you can see the snapshot from my QVW file, my table shows that the sum of growth against Vendor FF for Customer1 in FY14 is $1,945,765.09 and sum of forecast is $1,945,765.09
However, if you look at my raw data, sum of growth for Vendor FF for customer 1 in FY14 should be $327,488.29 same goes to sum of forecast $327,488.29
Thanks in advance!
- Tags:
- new_to_qlikview
- « Previous Replies
-
- 1
- 2
- Next Replies »
- Mark as New
- Bookmark
- Subscribe
- Mute
- Subscribe to RSS Feed
- Permalink
- Report Inappropriate Content
Hi Susan ,
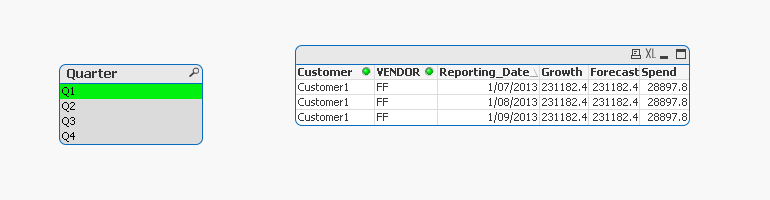
if you see the attached image , spend is at month level where as growth and forecast are at quarter level .
Regards,
Saurabh
- Mark as New
- Bookmark
- Subscribe
- Mute
- Subscribe to RSS Feed
- Permalink
- Report Inappropriate Content
Hi,
can you post your script since I working on Personal edition so not able to open your QVW
Regards
Please appreciate our Qlik community members by giving Kudos for sharing their time for your query. If your query is answered, please mark the topic as resolved 🙂
- Mark as New
- Bookmark
- Subscribe
- Mute
- Subscribe to RSS Feed
- Permalink
- Report Inappropriate Content
Hi Susan,
There are duplicate value in Growth and Forecast Data..
Try with
SUM(Distinct Growth)
SUM(Distinct Forecast)
you will get the Desired output. You can check the Frequency to see this..
- Mark as New
- Bookmark
- Subscribe
- Mute
- Subscribe to RSS Feed
- Permalink
- Report Inappropriate Content
FYI.. directory; FOR EACH vFile in FileList('D:\Users\d642527\Desktop\Example\*.xlsx'); ODBC CONNECT32 To [Excel Files;DBQ=$(vFile)]; Sheets: SQLTABLES; DISCONNECT; For i = 0 To NoOfRows('Sheets')-1 Let vSheet = left(Peek('TABLE_NAME', i, 'Sheets'), len(Peek('TABLE_NAME', i, 'Sheets'))-1); //============================================ Datatable: CrossTable(Date, Data, 5) LOAD '$(vSheet)' as Customer, * FROM [$(vFile)] (ooxml, embedded labels, table is $(vSheet)) WHERE(not IsNull(VENDOR)); Next; DROP Table Sheets; Next; Final: LOAD Customer, VENDOR, TYPE as [Project Type], Forecast, Growth, Date(Num#(Date)) AS Reporting_Date, //Date(Date) AS [Reporting Calendar Date], Date(Floor(Num#(Date)),'MMM-YY') as MonthYear, Year(Date(Num#(Date,'MMM-YY'))) as Year, Month(Date(Num#(Date,'MMM-YY'))) as Month, if(Month(Date(Num#(Date,'MMM-YY')))='Jan','Q3', if(Month(Date(Num#(Date,'MMM-YY')))='Feb','Q3', if(Month(Date(Num#(Date,'MMM-YY')))='Mar','Q3', if(Month(Date(Num#(Date,'MMM-YY')))='Apr','Q4', if(Month(Date(Num#(Date,'MMM-YY')))='May','Q4', if(Month(Date(Num#(Date,'MMM-YY')))='Jun','Q4', if(Month(Date(Num#(Date,'MMM-YY')))='Jul','Q1', if(Month(Date(Num#(Date,'MMM-YY')))='Aug','Q1', if(Month(Date(Num#(Date,'MMM-YY')))='Sep','Q1', if(Month(Date(Num#(Date,'MMM-YY')))='Oct','Q2', if(Month(Date(Num#(Date,'MMM-YY')))='Nov','Q2', if(Month(Date(Num#(Date,'MMM-YY')))='Dec','Q2')))))))))))) as Quarter, if(Date(Floor(Num#(Date)),'MMM-YY')='Jul-13','FY14', if(Date(Floor(Num#(Date)),'MMM-YY')='Aug-13','FY14', if(Date(Floor(Num#(Date)),'MMM-YY')='Sep-13','FY14', if(Date(Floor(Num#(Date)),'MMM-YY')='Oct-13','FY14', if(Date(Floor(Num#(Date)),'MMM-YY')='Nov-13','FY14', if(Date(Floor(Num#(Date)),'MMM-YY')='Dec-13','FY14', if(Date(Floor(Num#(Date)),'MMM-YY')='Jan-14','FY14', if(Date(Floor(Num#(Date)),'MMM-YY')='Feb-14','FY14', if(Date(Floor(Num#(Date)),'MMM-YY')='Mar-14','FY14', if(Date(Floor(Num#(Date)),'MMM-YY')='Apr-14','FY14', if(Date(Floor(Num#(Date)),'MMM-YY')='May-14','FY14', if(Date(Floor(Num#(Date)),'MMM-YY')='Jun-14','FY14', if(Date(Floor(Num#(Date)),'MMM-YY')='Jul-14','FY15', if(Date(Floor(Num#(Date)),'MMM-YY')='Aug-14','FY15', if(Date(Floor(Num#(Date)),'MMM-YY')='Sep-14','FY15', if(Date(Floor(Num#(Date)),'MMM-YY')='Oct-14','FY15', if(Date(Floor(Num#(Date)),'MMM-YY')='Nov-14','FY15', if(Date(Floor(Num#(Date)),'MMM-YY')='Dec-14','FY15', if(Date(Floor(Num#(Date)),'MMM-YY')='Jan-15','FY15', if(Date(Floor(Num#(Date)),'MMM-YY')='Feb-15','FY15', if(Date(Floor(Num#(Date)),'MMM-YY')='Mar-15','FY15', if(Date(Floor(Num#(Date)),'MMM-YY')='Apr-15','FY15', if(Date(Floor(Num#(Date)),'MMM-YY')='May-15','FY15', if(Date(Floor(Num#(Date)),'MMM-YY')='Jun-15','FY15', if(Date(Floor(Num#(Date)),'MMM-YY')='Jul-15','FY16', if(Date(Floor(Num#(Date)),'MMM-YY')='Aug-15','FY16', if(Date(Floor(Num#(Date)),'MMM-YY')='Sep-15','FY16', if(Date(Floor(Num#(Date)),'MMM-YY')='Oct-15','FY16', if(Date(Floor(Num#(Date)),'MMM-YY')='Nov-15','FY16', if(Date(Floor(Num#(Date)),'MMM-YY')='Dec-15','FY16', if(Date(Floor(Num#(Date)),'MMM-YY')='Jan-16','FY16', if(Date(Floor(Num#(Date)),'MMM-YY')='Feb-16','FY16', if(Date(Floor(Num#(Date)),'MMM-YY')='Mar-16','FY16', if(Date(Floor(Num#(Date)),'MMM-YY')='Apr-16','FY16', if(Date(Floor(Num#(Date)),'MMM-YY')='May-16','FY16', if(Date(Floor(Num#(Date)),'MMM-YY')='Jun-16','FY16', )))))))))))))))))))))))))))))))))))) as FY, Data as Spend Resident Datatable; Drop Table Datatable; //=========================== // DATE(DATE#(left(FileName(),10),'YYYY-MM-DD'),'YYYY/MM/DD') as [Reporting Calendar Date], // //DATE(DATE#(LEFT(RIGHT(FileName(),19),10),’YYYY-MM-DD’),’'YYYY/MM/DD'’) as FileDate, // today()-[PO Date] as [PO Age Days], // if(today()-[PO Date]>180,'> 6 Months', // if(today()-[PO Date]>90,'3-6 Months','< 3 Months')) as [PO Age], //==========================
- Mark as New
- Bookmark
- Subscribe
- Mute
- Subscribe to RSS Feed
- Permalink
- Report Inappropriate Content
Hi dreamer4
PFA
- Mark as New
- Bookmark
- Subscribe
- Mute
- Subscribe to RSS Feed
- Permalink
- Report Inappropriate Content
Have a look at this.
- Mark as New
- Bookmark
- Subscribe
- Mute
- Subscribe to RSS Feed
- Permalink
- Report Inappropriate Content
Hi Susan,
Just a suggestion, Instead of using Multiple if's you can create two Mapping Load Table and use it..
You can the add the data easily when you are using inline Load (small table). In your script, I modified the below..
directory;

FOR EACH vFile in FileList('D:\Users\d642527\Desktop\Example\*.xlsx');

     ODBC CONNECT32 To [Excel Files;DBQ=$(vFile)];
     Sheets:
     SQLTABLES;
     DISCONNECT;
  For i = 0 To NoOfRows('Sheets')-1

          Let vSheet = left(Peek('TABLE_NAME', i, 'Sheets'), len(Peek('TABLE_NAME', i, 'Sheets'))-1);


//============================================
Datatable:
CrossTable(Date, Data, 5)
LOAD '$(vSheet)' as Customer,
  *
FROM
[$(vFile)]
(ooxml, embedded labels, table is $(vSheet))
WHERE(not IsNull(VENDOR));
Next;
DROP Table Sheets;
Next;

Mapping_FY:
Mapping LOAD * INLINE [
    MonthYear, FY
    Jan-14, FY14
    Feb-14, FY14
    Mar-14, FY14
    Apr-14, FY14
    May-14, FY14
    Jun-14, FY14
    Dec-13, FY14
    Jul-13, FY14
    Aug-13, FY14
    Oct-13, FY14
    Nov-13, FY14
    Aug-14, FY15
    Dec-14, FY15
    Mar-15, FY15
    Apr-15, FY15
    Jul-14, FY15
    Sep-14, FY15
    Oct-14, FY15
    Jun-15, FY15
    Jan-15, FY15
    May-15, FY15
    Nov-14, FY15
    Sep-13, FY14
    Feb-15, FY15
];

Mapping_Qtr:
Mapping LOAD * INLINE [
    Month, Quarter
    1, Q3
    2, Q3
    3, Q3
    4, Q4
    5, Q4
    6, Q4
    7, Q1
    8, Q1
    9, Q1
    10, Q2
    11, Q2
    12, Q2
];

Final:
LOAD Customer,
  VENDOR,
  TYPE as [Project Type],
  Forecast,
        Growth,
  Date(Num#(Date)) AS Reporting_Date,
  //Date(Date) AS [Reporting Calendar Date],
  Date(Floor(Num#(Date)),'MMM-YY') as MonthYear,
  Year(Date(Num#(Date,'MMM-YY'))) as Year,
  Month(Date(Num#(Date,'MMM-YY'))) as Month,
  ApplyMap('Mapping_Qtr',Month(Date(Num#(Date,'MMM-YY')))) as Quarter,
  ApplyMap('Mapping_FY',
  text(Date(Floor(Num#(Date)),'MMM-YY')) ) as FY,
  Data as Spend
Resident Datatable;
Drop Table Datatable;
- Mark as New
- Bookmark
- Subscribe
- Mute
- Subscribe to RSS Feed
- Permalink
- Report Inappropriate Content
Hi Settu,
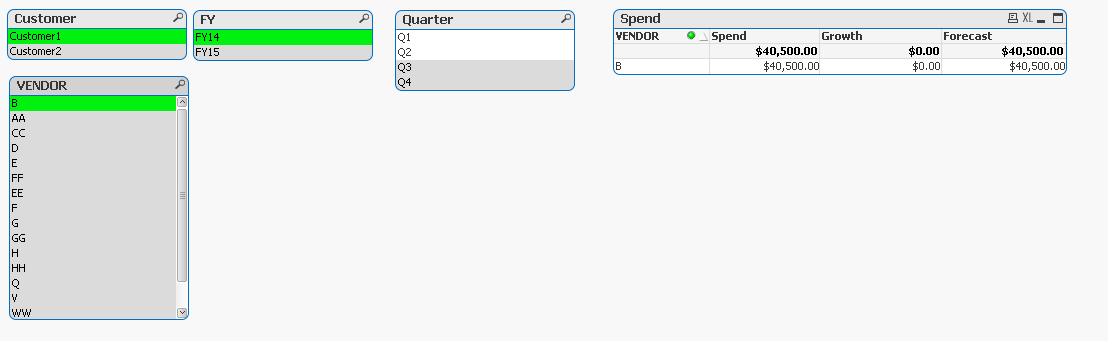
hmm something doesn't seem quite right. Most of the values seem to be pulling correctly, however some are still incorrect. For example if you select vendor B, FY14 and Customer 1, you will get the below output, whereas in the raw data if you look at the FY1314_Report. Vendor B should have forecast budget of $48,471.58 and Growth of $7971.58
Appreciate your help!

- Mark as New
- Bookmark
- Subscribe
- Mute
- Subscribe to RSS Feed
- Permalink
- Report Inappropriate Content
Hi Pradip,
You had the same suggestion as Settu, however something doesn't seem quite right. Most of the values seem to be pulling correctly, however some are still incorrect.
For example if you select vendor B, FY14 and Customer 1, you will get the below output, whereas in the raw data if you look at the FY1314_Report. Vendor B should have forecast budget of $48,471.58 and Growth of $7971.58
Appreciate your help too!
- « Previous Replies
-
- 1
- 2
- Next Replies »