Unlock a world of possibilities! Login now and discover the exclusive benefits awaiting you.
- Qlik Community
- :
- All Forums
- :
- QlikView App Dev
- :
- Re: Filter on curve chart dimension while keeping ...
- Subscribe to RSS Feed
- Mark Topic as New
- Mark Topic as Read
- Float this Topic for Current User
- Bookmark
- Subscribe
- Mute
- Printer Friendly Page
- Mark as New
- Bookmark
- Subscribe
- Mute
- Subscribe to RSS Feed
- Permalink
- Report Inappropriate Content
Filter on curve chart dimension while keeping cumulated count of measures
Hello everyone,
I am facing difficulties trying to build a Curve chart in my application (I am new to Qlik Sense). My chart aims to display the evolution of a cumulated number of activities launched over time (where time scale are the weeks and years of activities starting date). My data come from an Excel file in which I have a list of activities with a starting date associated.
Here are the data displayed on my chart :
- Dimension : Week & Year (during which activities are started)
- Measures : Cumulated count of activities.
Some activities I am dealing with are starting in 2016, others in 2017, others in 2018 and others in 2019.
I would like to calculate the cumulated count of activities in this full range of time but only display the curve from 2018 to 2019.
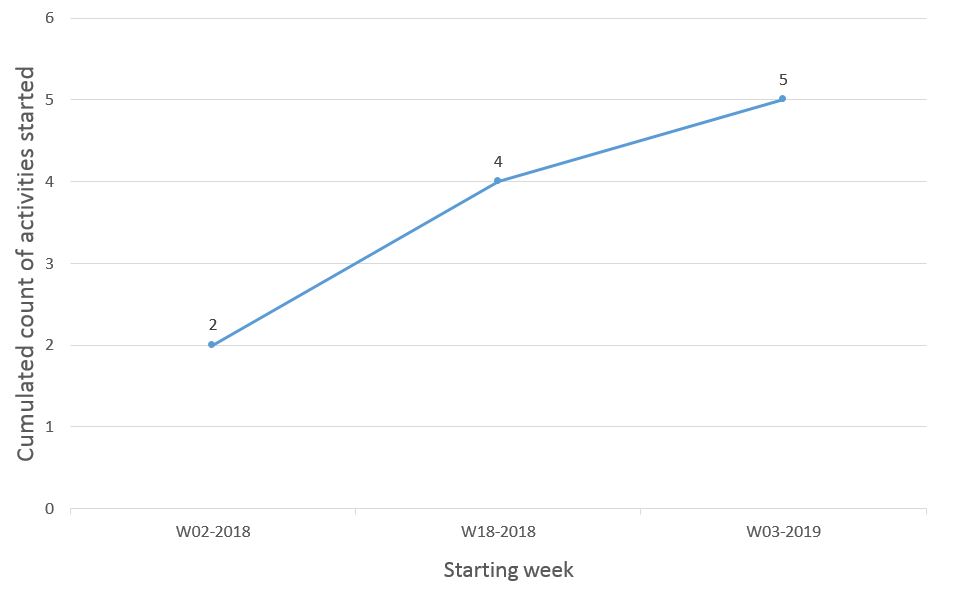
My issue is that when I try to filter or limit the values in my dimension from 2018 to 2019, cumulated number of activities of 2016 and 2017 are lost and the cumulative count only works for activities between 2018 and 2019.
Here is a schematic illustration of my problem :
Chart I currently have :
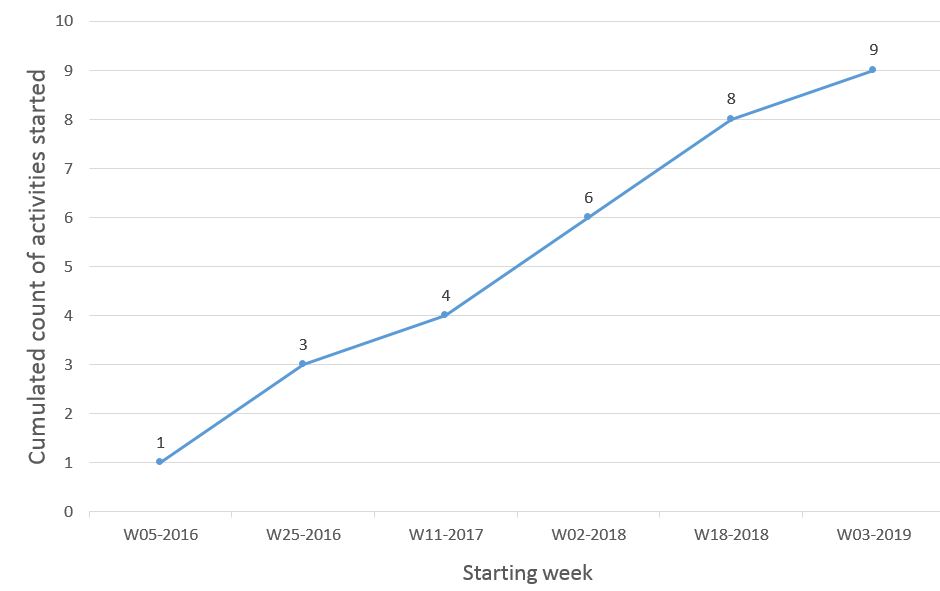
Chart I want to have :
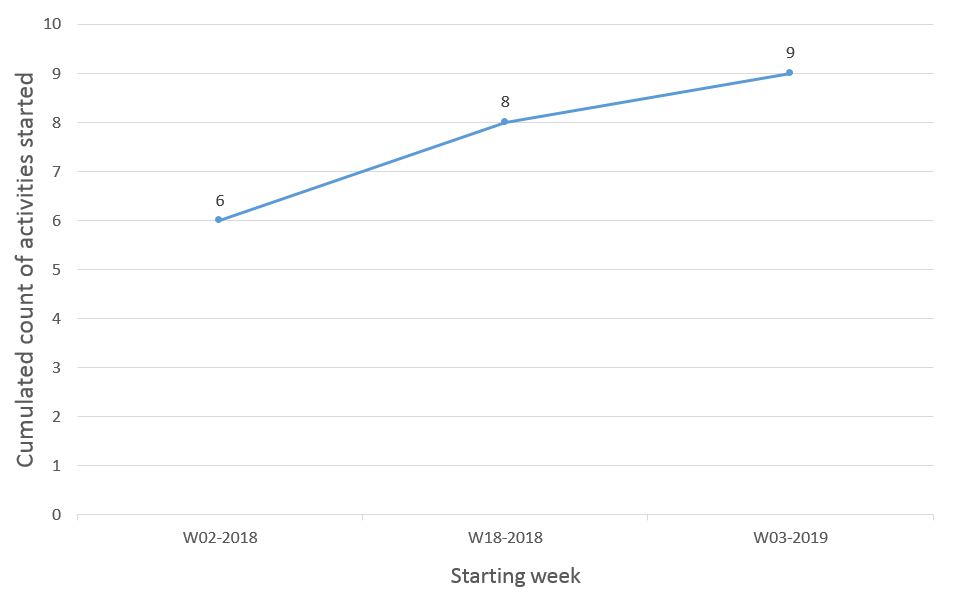
Chart I actually have when I try to limit dimension value:
Any idea of how I can do to obtain the wanted curve ?
I really hope some of you will be able to help me.
Accepted Solutions
- Mark as New
- Bookmark
- Subscribe
- Mute
- Subscribe to RSS Feed
- Permalink
- Report Inappropriate Content
Try this
RangeSum(Above(Count({<StartDate>}ActivityID), 0, RowNo())) * Avg({<StartDate = {"$(='>=' & Date(Max(StartDate)-498) & '<=' & Date(Max(StartDate)))"}>}1)
- Mark as New
- Bookmark
- Subscribe
- Mute
- Subscribe to RSS Feed
- Permalink
- Report Inappropriate Content
Can you upload the qvw?
Maybe with scrambled data if you have sensitive data in your app!
- Mark as New
- Bookmark
- Subscribe
- Mute
- Subscribe to RSS Feed
- Permalink
- Report Inappropriate Content
What is your chart dimension and what is the expression you are using?
- Mark as New
- Bookmark
- Subscribe
- Mute
- Subscribe to RSS Feed
- Permalink
- Report Inappropriate Content
Hello,
here are the dimension, the measure and the expressions I am using :
Chart dimension : starting date
Expression for chart dimension : =Dual('W'&Num(Week([StartDate]),00)&'-'&Num(Year([StartDate]),0000), Num(Week([StartDate]),00)&'-'&Num(Year([StartDate]),0000))
Chart measure : Cumulated count of activities started
Expression for measure : RangeSum(Above( Count( ActvityID),0,RowNo()))
I think that the problem may come from my expression in the "measure" field that may not be suited for what I want to do.
- Mark as New
- Bookmark
- Subscribe
- Mute
- Subscribe to RSS Feed
- Permalink
- Report Inappropriate Content
Hello,
Here is my chart that I reproduced with similar data in a new app :
What I would like to do is to display the curve only from W24-2018 to W43-2019 but by keeping the cumulated value of previous dates. I want W24-2018 cumulated count to be 70 and so on.
- Mark as New
- Bookmark
- Subscribe
- Mute
- Subscribe to RSS Feed
- Permalink
- Report Inappropriate Content
Try this
RangeSum(Above(Count({<StartDate>}ActivityID), 0, RowNo())) * Avg({<StartDate = {"$(='>=' & Date(Max(StartDate)-498) & '<=' & Date(Max(StartDate)))"}>}1)
- Mark as New
- Bookmark
- Subscribe
- Mute
- Subscribe to RSS Feed
- Permalink
- Report Inappropriate Content
Hello,
I understand, and it works  Thank you very much !!