Unlock a world of possibilities! Login now and discover the exclusive benefits awaiting you.
- Qlik Community
- :
- All Forums
- :
- QlikView App Dev
- :
- Filter
- Subscribe to RSS Feed
- Mark Topic as New
- Mark Topic as Read
- Float this Topic for Current User
- Bookmark
- Subscribe
- Mute
- Printer Friendly Page
- Mark as New
- Bookmark
- Subscribe
- Mute
- Subscribe to RSS Feed
- Permalink
- Report Inappropriate Content
Filter
Hi guys,
I'm trying to build a graph, which has a drill down group, and I currently have a few filters that apply to it. I want the filters to only allow one value to be selected for all dimensions in the group but one. so for example, I have monthly and yearly data for a number of shops in different regions, so my drill down group is country->region-->city-->shop and for the first three I just one to see the data for one month, but for the shop I want the graph to show a few months. Trouble is, when I enable multiple selections in the months filter, the graph has too much data and looks ridiculous. Any suggestions how I can overcome this?
Thank you,
Anna
- Tags:
- new_to_qlikview
- Mark as New
- Bookmark
- Subscribe
- Mute
- Subscribe to RSS Feed
- Permalink
- Report Inappropriate Content
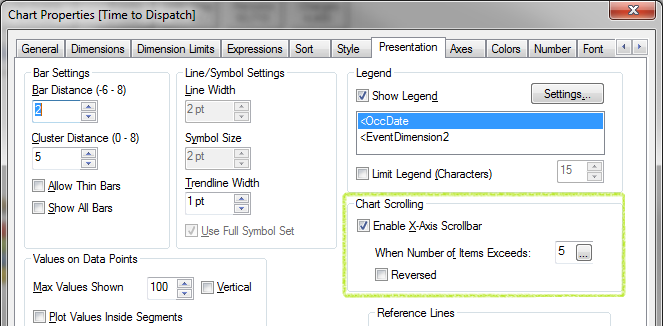
Hello, Have you tried enabling the X-Axis scroll bar?
- Mark as New
- Bookmark
- Subscribe
- Mute
- Subscribe to RSS Feed
- Permalink
- Report Inappropriate Content
I did, but it still looks rubbish when multiple selection is enabled at higher level of the drill down group. Thanks for trying though!
- Mark as New
- Bookmark
- Subscribe
- Mute
- Subscribe to RSS Feed
- Permalink
- Report Inappropriate Content
How about Dimension Limits?
- Mark as New
- Bookmark
- Subscribe
- Mute
- Subscribe to RSS Feed
- Permalink
- Report Inappropriate Content
that could potentially work, however, I want to apply it to 3 levels of the drill down group, and leave one out.