Unlock a world of possibilities! Login now and discover the exclusive benefits awaiting you.
- Qlik Community
- :
- All Forums
- :
- QlikView App Dev
- :
- Re: Filtering a Graph Using a Variable
- Subscribe to RSS Feed
- Mark Topic as New
- Mark Topic as Read
- Float this Topic for Current User
- Bookmark
- Subscribe
- Mute
- Printer Friendly Page
- Mark as New
- Bookmark
- Subscribe
- Mute
- Subscribe to RSS Feed
- Permalink
- Report Inappropriate Content
Filtering a Graph Using a Variable
Hello,
I'm new to this, so apologies in advance if this is very straightforward:
I've created a bar chart which shows revenue against a time period. For simplicity of loading, I've combined the Month to Date and Year to Date figures in one table, so the data is like the following.
Date Period Revenue
1 10
2 15
3 20
4 15
Jan 300
Feb 280
Mar 340
The graph currently displays all data together
I have a toggle button which changes a variable so it shows either 1 (MTD) or 2 (YTD). My aim is when the variable = 1 that it only shows the MTD information, ie 1,2,3,4,etc and when it = 2, it only shows the YTD information, ie, Jan, Feb, etc.
Is this possible?
Thanks in advance.
R
- Tags:
- new_to_qlikview
- Mark as New
- Bookmark
- Subscribe
- Mute
- Subscribe to RSS Feed
- Permalink
- Report Inappropriate Content
Hello,
you could try the following. Set conditionals for your Dimensions under the Bar Chart Proporties.
For MTD insert "=if('yourVariable' = 1,0,1)" and for YTD insert "=if('yourVariable' = 0,0,1)". If you then click the Button your Bar Chart should change. Let me know if this helps you.
Best Regards,
Steven
- Mark as New
- Bookmark
- Subscribe
- Mute
- Subscribe to RSS Feed
- Permalink
- Report Inappropriate Content
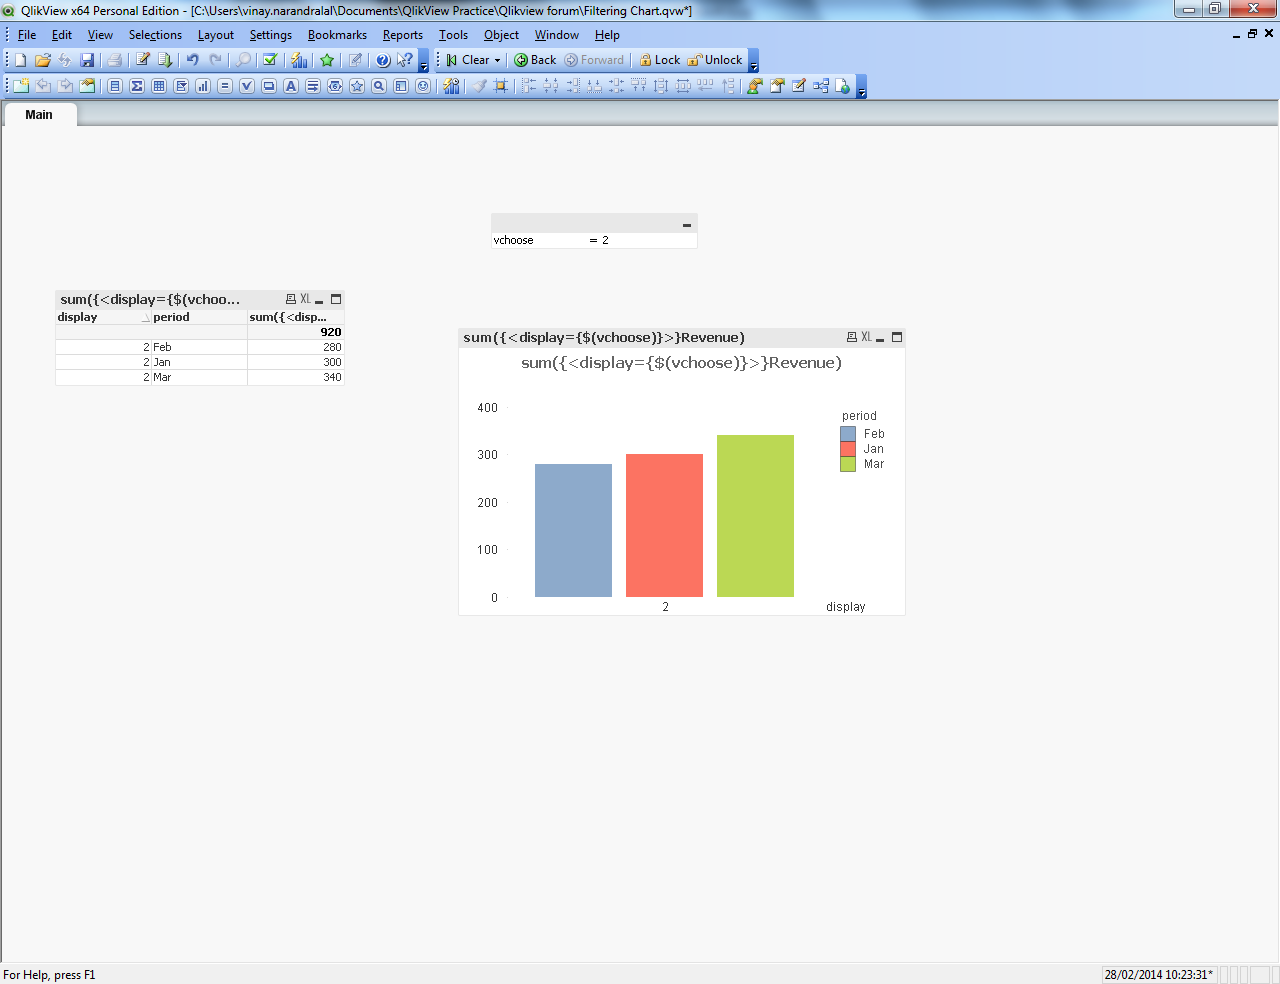
You need to add one more field as identifier to identify MTD or YTD. I have add 'display' field.
see also image.
Load *
inline
[period, Revenue, display
1,10,1
2,15,1
3,20,1
4,15,1
Jan,300,2
Feb,280,2
Mar,340,2
];

- Mark as New
- Bookmark
- Subscribe
- Mute
- Subscribe to RSS Feed
- Permalink
- Report Inappropriate Content
See qvw file.
Vinay
- Mark as New
- Bookmark
- Subscribe
- Mute
- Subscribe to RSS Feed
- Permalink
- Report Inappropriate Content
Hello,
I tried Steven's solution without success - which is probably down to me lack of knowledge rather than the solution not being right as it seems like it should work. I then tried Vinay's and that seems to have done the trick.
Thanks to both of you for your suggestions
Rich
- Mark as New
- Bookmark
- Subscribe
- Mute
- Subscribe to RSS Feed
- Permalink
- Report Inappropriate Content
Hi Rich,
I developed two sample application as per your need. you can use which ever you want.
Find it in attachment.