Unlock a world of possibilities! Login now and discover the exclusive benefits awaiting you.
- Qlik Community
- :
- All Forums
- :
- QlikView App Dev
- :
- Filtering of pivot chart
- Subscribe to RSS Feed
- Mark Topic as New
- Mark Topic as Read
- Float this Topic for Current User
- Bookmark
- Subscribe
- Mute
- Printer Friendly Page
- Mark as New
- Bookmark
- Subscribe
- Mute
- Subscribe to RSS Feed
- Permalink
- Report Inappropriate Content
Filtering of pivot chart
Hello All,
I would like to learn how to filer pivot chart result.
example.
In my below mention example, I would to filter result base on selection.
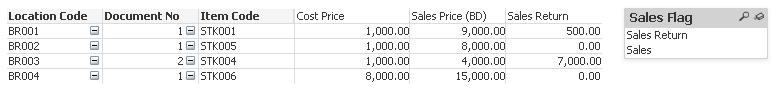
Normal Display:
| Location Code | Document No | Item Code | Cost Price | Sales Price (BD) | Sales Return |
| BR001 | 1 | STK001 | 1,000.00 | 9,000.00 | 500.00 |
| BR002 | 1 | STK005 | 1,000.00 | 8,000.00 | 0.00 |
| BR003 | 2 | STK004 | 1,000.00 | 4,000.00 | 7,000.00 |
| BR004 | 1 | STK006 | 8,000.00 | 15,000.00 | 0.00 |
Filtering records where Sales Return is ZERO
| Location Code | Document No | Item Code | Cost Price | Sales Price (BD) | Sales Return |
| BR002 | 1 | STK005 | 1,000.00 | 8,000.00 | 0.00 |
| BR004 | 1 | STK006 | 8,000.00 | 15,000.00 | 0.00 |
Filtering records where Sales Return is not ZERO
| Location Code | Document No | Item Code | Cost Price | Sales Price (BD) | Sales Return |
| BR001 | 1 | STK001 | 1,000.00 | 9,000.00 | 500.00 |
| BR003 | 2 | STK004 | 1,000.00 | 4,000.00 | 7,000.00 |
To do that:
It will be greate if we can do filtering through User defined value in list box, if not may be any other better way.
I had attached example and modified my main post with result.
Thanks in advance.
- « Previous Replies
-
- 1
- 2
- Next Replies »
- Mark as New
- Bookmark
- Subscribe
- Mute
- Subscribe to RSS Feed
- Permalink
- Report Inappropriate Content
Once again Thanks,
After following instruction from word documet when I had created list box and add below mention expression now I am able to filter the records.
You guys are great help to qlickview learner.
God Blass you all.
- « Previous Replies
-
- 1
- 2
- Next Replies »