Unlock a world of possibilities! Login now and discover the exclusive benefits awaiting you.
- Qlik Community
- :
- All Forums
- :
- QlikView App Dev
- :
- Filtering on Pre Calculated Data
- Subscribe to RSS Feed
- Mark Topic as New
- Mark Topic as Read
- Float this Topic for Current User
- Bookmark
- Subscribe
- Mute
- Printer Friendly Page
- Mark as New
- Bookmark
- Subscribe
- Mute
- Subscribe to RSS Feed
- Permalink
- Report Inappropriate Content
Filtering on Pre Calculated Data
Hi,
I'm new to Qlik and would like to know how I can view the following data created via a GROUPING SETS statement in SQL. This was used because there are many-to-many relationships between the dimensions.
If you're not familiar with GROUPING SETS data, the first row below totals the unique users for one dimension (Country) and the other rows totals the unique users for two dimensions (Country and Device). This is because some users may have more than one device.
| Country | Device | Total Unique Users |
|---|---|---|
| FRANCE | NULL | 50,000 |
| FRANCE | iOS | 26,000 |
| FRANCE | Android | 25,000 |
I want the user who selects Country=FRANCE as the only filter to return 50,000 unique users and not a sum of all rows containing Country=FRANCE.
How is this best achieved in Qlik? Or should I not be using precalculated fields at all in Qlik, and instead use the user level data (what happens if this is very large)?
Thanks
- « Previous Replies
-
- 1
- 2
- Next Replies »
Accepted Solutions
- Mark as New
- Bookmark
- Subscribe
- Mute
- Subscribe to RSS Feed
- Permalink
- Report Inappropriate Content
edit: Sunny is always faster in creating sample apps...
But his expression should also work in Sense
- Mark as New
- Bookmark
- Subscribe
- Mute
- Subscribe to RSS Feed
- Permalink
- Report Inappropriate Content
You want to see 50,000 because it is Device = NULL? Will that be true for other countries also? If it is, then you can try this:
Sum({<Device = {'NULL'}>} [Total Unique Users])
- Mark as New
- Bookmark
- Subscribe
- Mute
- Subscribe to RSS Feed
- Permalink
- Report Inappropriate Content
Just load the rows where Device > '' (or Device <> 'NULL') to exclude the Country Total row, then your data will sum correctly in Qlik.
The other option is to load the raw data and let Qlik calculate the sum. This may prove more flexible. 50,000 rows is not big for Qlik systems.
- Mark as New
- Bookmark
- Subscribe
- Mute
- Subscribe to RSS Feed
- Permalink
- Report Inappropriate Content
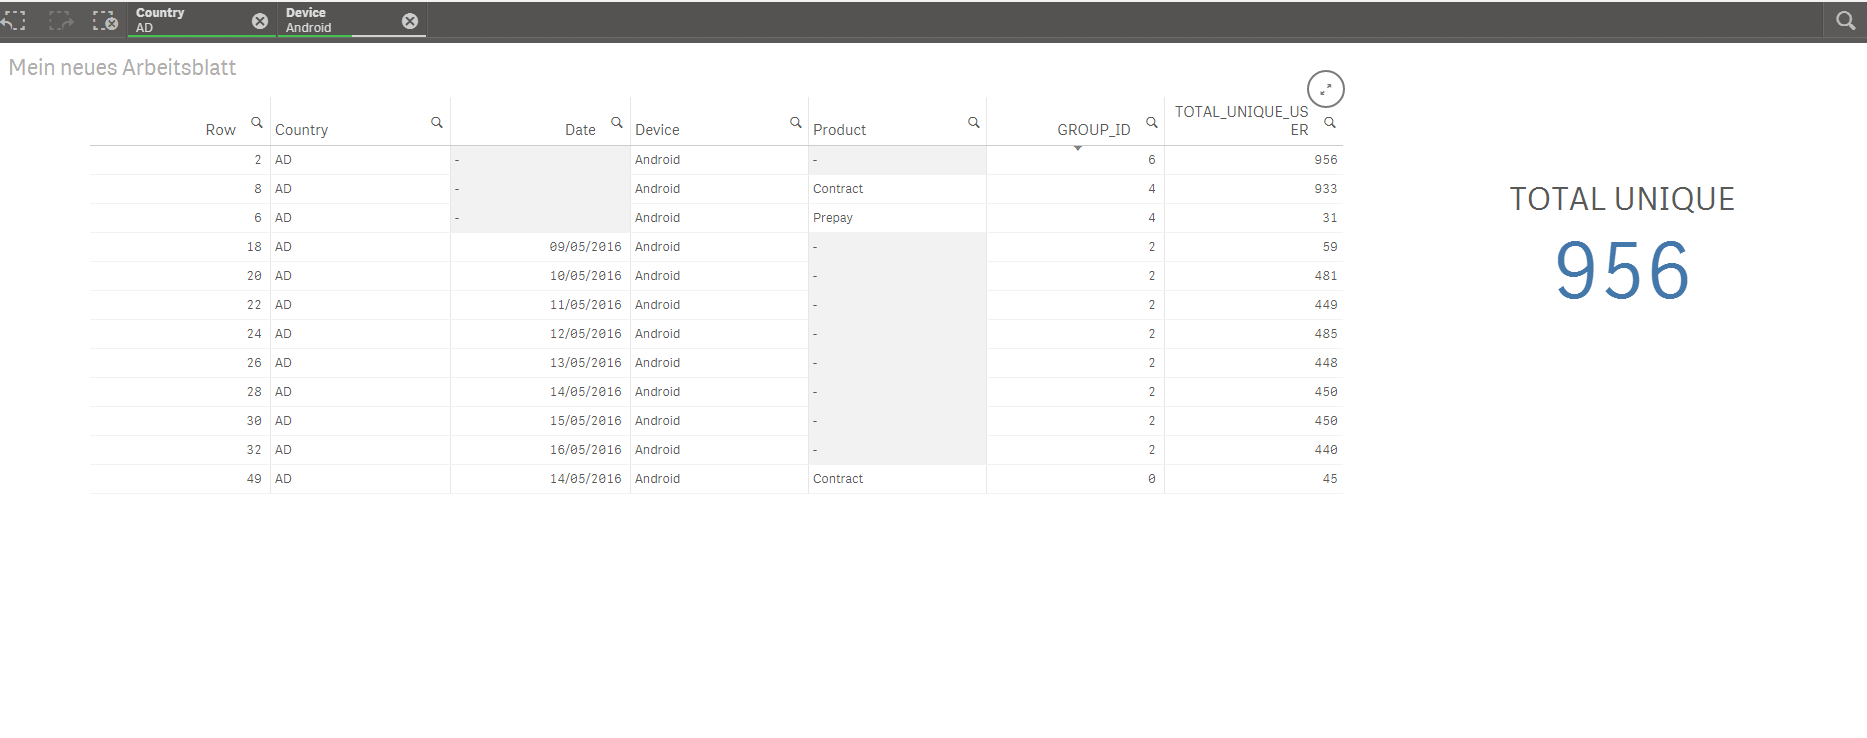
Thanks for the responses. The actual table I have is a lot larger and with more dimensions than the illustrated (simplified) version above. Attached is a screenshot of the table I'm working on.
The QV dashboard needs to be built such that:
- When Country "AD" is selected (and nothing else) it returns 1,598 users
- When Country "AD" and Product="Prepay" is selected it returns 71 Users
- When Country "AD" and Product="Prepay" and Date="10/05/2016" is selected it returns 24 Users
- and so on...
I agree that only the raw user level data will provide the most flexibility however this data is very large (100s of millions of rows) and will grow over time even larger. The example here is for one of our smallest countries (Andorra!) so you get the picture.
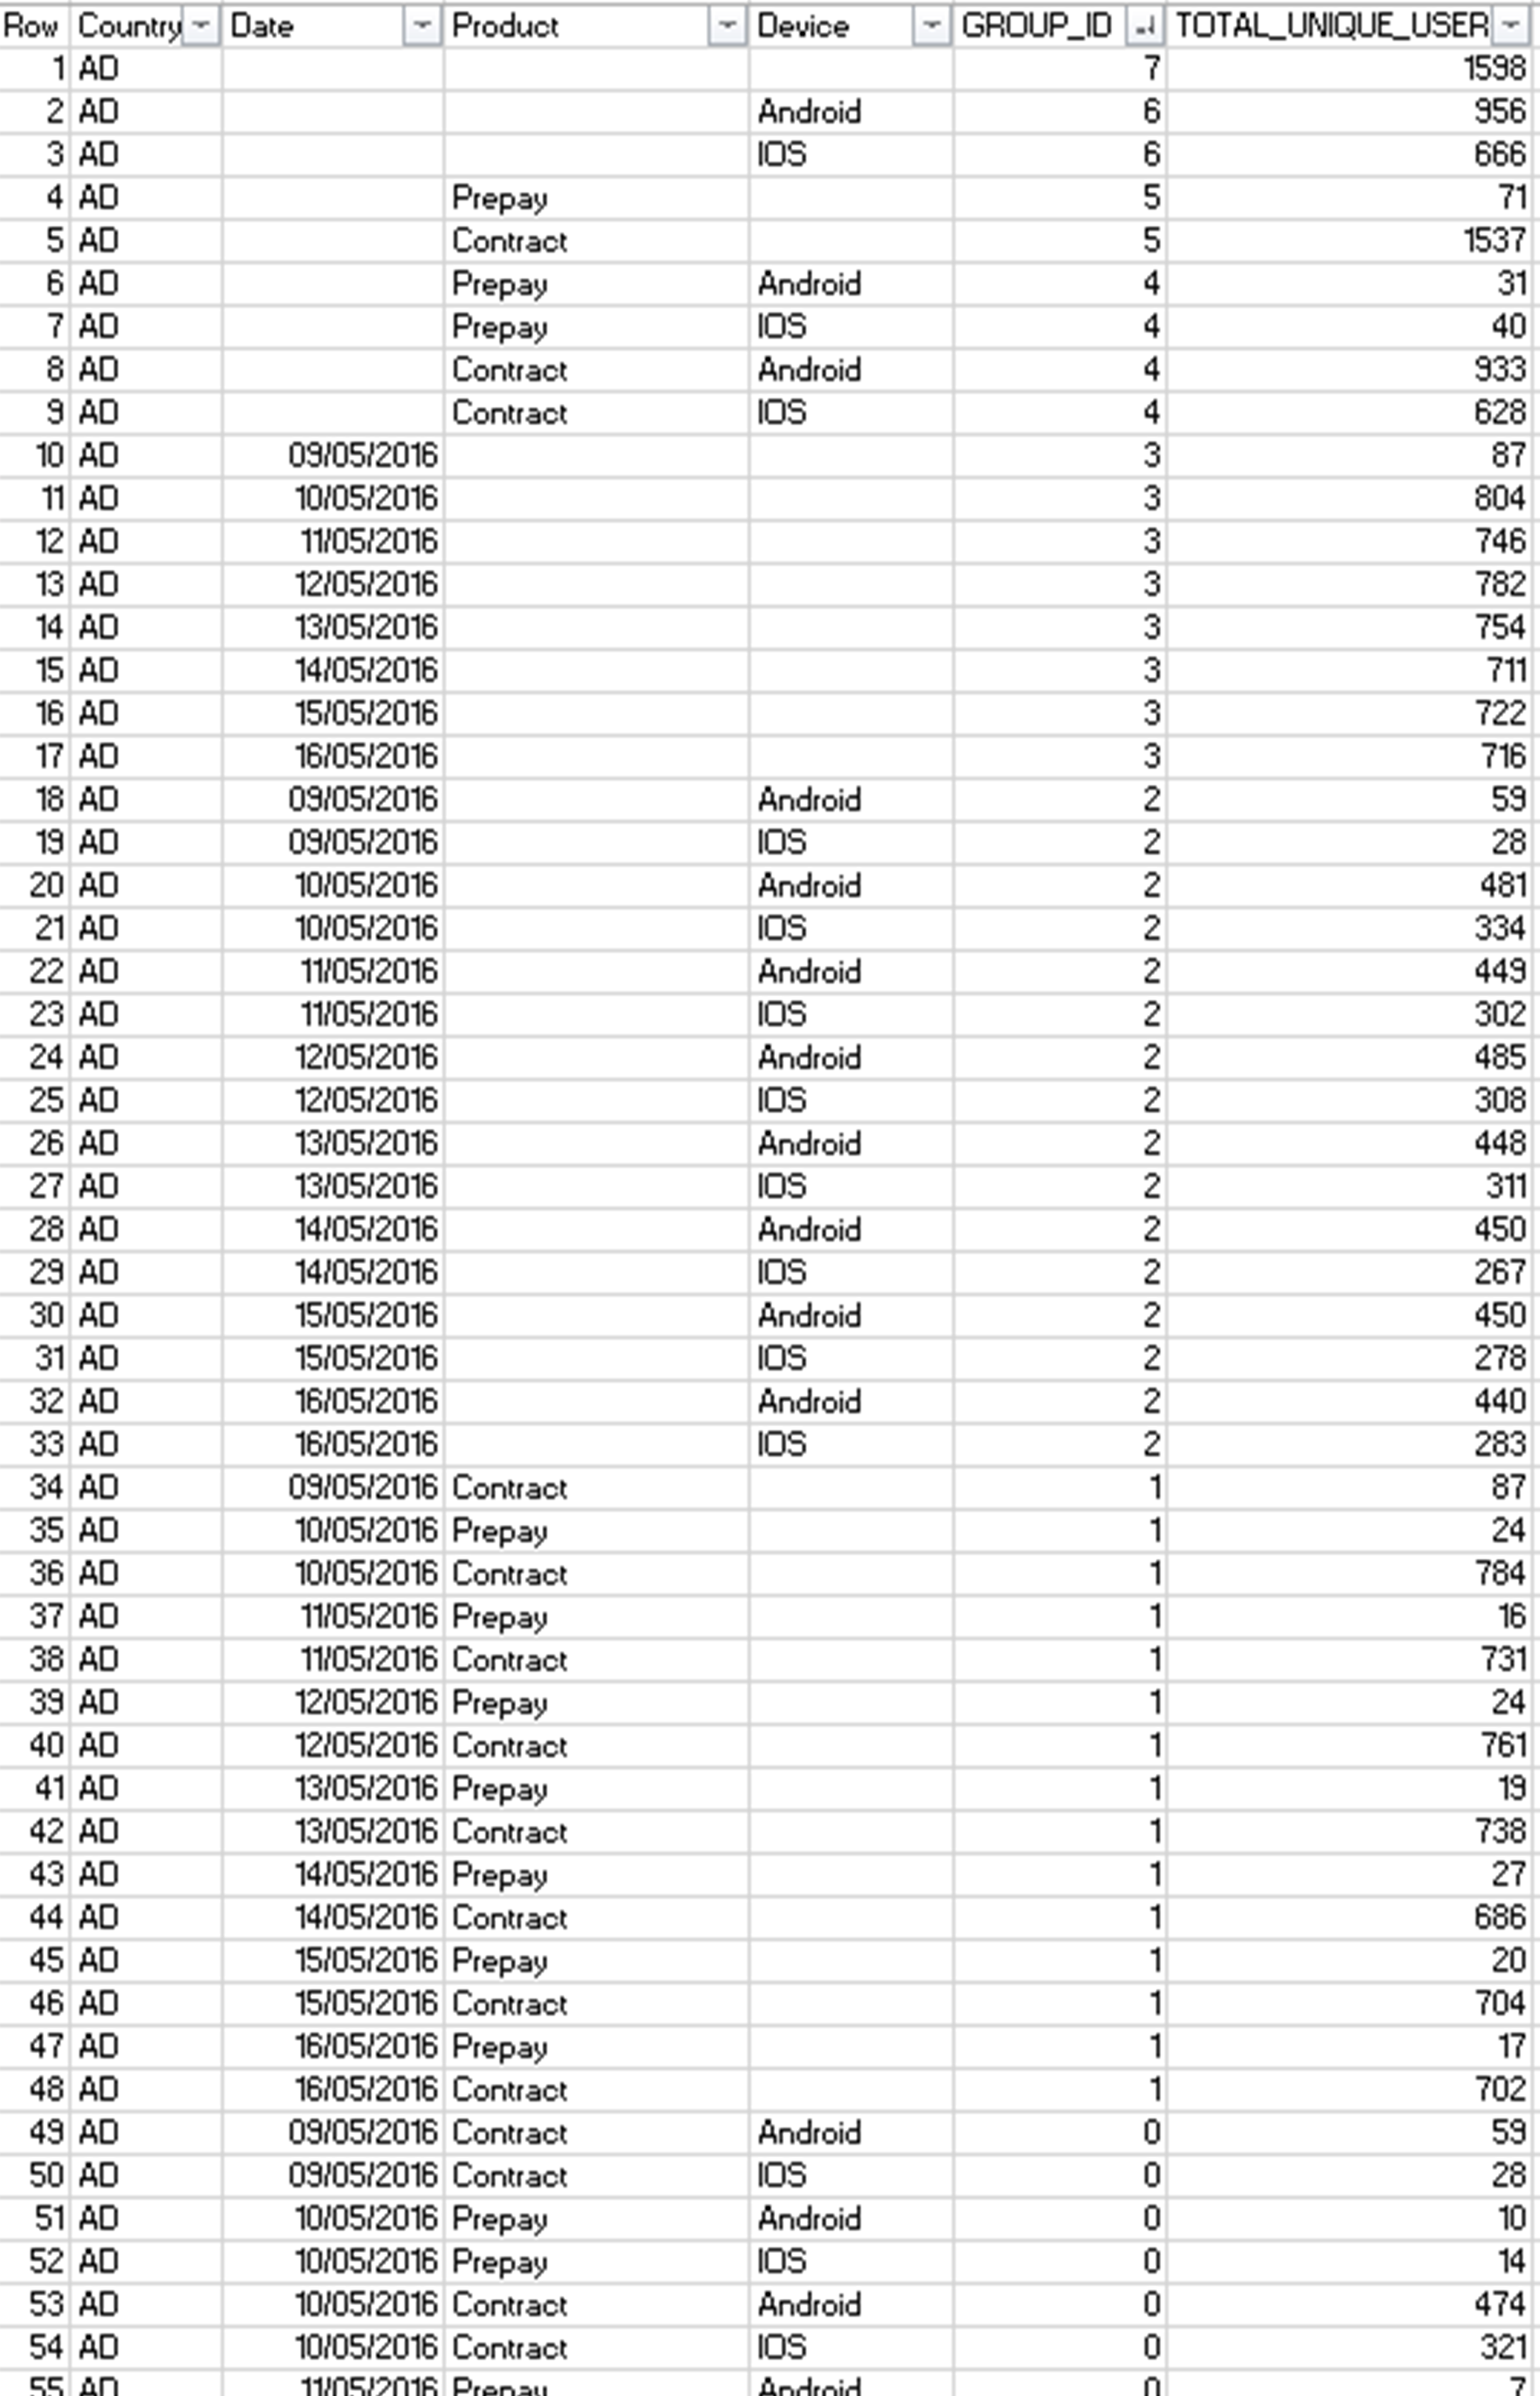
I have tried to use Qlik Expressions with the below using functions like GetCurrentSelection or GetSelectedCount for each field, but haven't managed to come up with anything neat yet. Is there anything I can do with the Group ID column below ?
Thanks
- Mark as New
- Bookmark
- Subscribe
- Mute
- Subscribe to RSS Feed
- Permalink
- Report Inappropriate Content
Try this:
=Only({<Row = {"=If(GetSelectedCount(Device) = 1, Len(Trim(Device)) > 0, Len(Trim(Device)) = 0) and
If(GetSelectedCount(Product) = 1, Len(Trim(Product)) > 0, Len(Trim(Product)) = 0) and
If(GetSelectedCount(Date) = 1, Len(Trim(Date)) > 0, Len(Trim(Date)) = 0)"}>}TOTAL_UNIQUE_USER)
You might need to add another If statement in the search string for Country as well.
I am attaching the sample for you to look at.
Best,
Sunny
NOTE: Instead of providing an image, it would be best if you can provide the sample in an Excel file.
- Mark as New
- Bookmark
- Subscribe
- Mute
- Subscribe to RSS Feed
- Permalink
- Report Inappropriate Content
Thank you Sunny for the sample (I absolutely agree that it's really helpful to post table files or INLINE tables as text to show some input records, and that it's not much fun recreating sample records from screenshots)!
I think the expression can be slightly simplified to
=FirstSortedValue(TOTAL_UNIQUE_USER, -GROUP_ID)
- Mark as New
- Bookmark
- Subscribe
- Mute
- Subscribe to RSS Feed
- Permalink
- Report Inappropriate Content
I had a feeling that your much simpler expression is on its way 
- Mark as New
- Bookmark
- Subscribe
- Mute
- Subscribe to RSS Feed
- Permalink
- Report Inappropriate Content
Thanks both for your responses to this.
I apologise for not attaching the data, this was my first time posting in these communities and I could only see an attachment for images in the client I was using yesterday. I've now attached the data file including the full data for all countries, so you'll find there's an extra dimension added to the cube.
I sadly can't open the .qvw files as I'm using a personal edition - is there a way around this?
I should also mention that I am building this in QlikSense but I hope that doesn't affect the formulae?
Thanks again
- Mark as New
- Bookmark
- Subscribe
- Mute
- Subscribe to RSS Feed
- Permalink
- Report Inappropriate Content
Hi,
Try this
Max(Aggr(Sum(TOTAL_UNIQUE_USER),Device,Country))
Kind regards
- Mark as New
- Bookmark
- Subscribe
- Mute
- Subscribe to RSS Feed
- Permalink
- Report Inappropriate Content
Stefan's expression should still work in QlikSense:
=FirstSortedValue(TOTAL_UNIQUE_USERS, -GROUP_ID)
- « Previous Replies
-
- 1
- 2
- Next Replies »