Unlock a world of possibilities! Login now and discover the exclusive benefits awaiting you.
- Qlik Community
- :
- All Forums
- :
- QlikView App Dev
- :
- Re: Font Color within Graph
- Subscribe to RSS Feed
- Mark Topic as New
- Mark Topic as Read
- Float this Topic for Current User
- Bookmark
- Subscribe
- Mute
- Printer Friendly Page
- Mark as New
- Bookmark
- Subscribe
- Mute
- Subscribe to RSS Feed
- Permalink
- Report Inappropriate Content
Font Color within Graph
So I'm trying to do what should be really simple - change the font color for the dimension labels, expression labels, within-chart title, and the legend.
For the dimension labels and legend I can get them to underline via Properties>Font>Underline. However the Color box on the Font sheet doesn't seem to actually do anything no matter what color I set it to.
Any thoughts on why this is?
- Tags:
- chart
Accepted Solutions
- Mark as New
- Bookmark
- Subscribe
- Mute
- Subscribe to RSS Feed
- Permalink
- Report Inappropriate Content
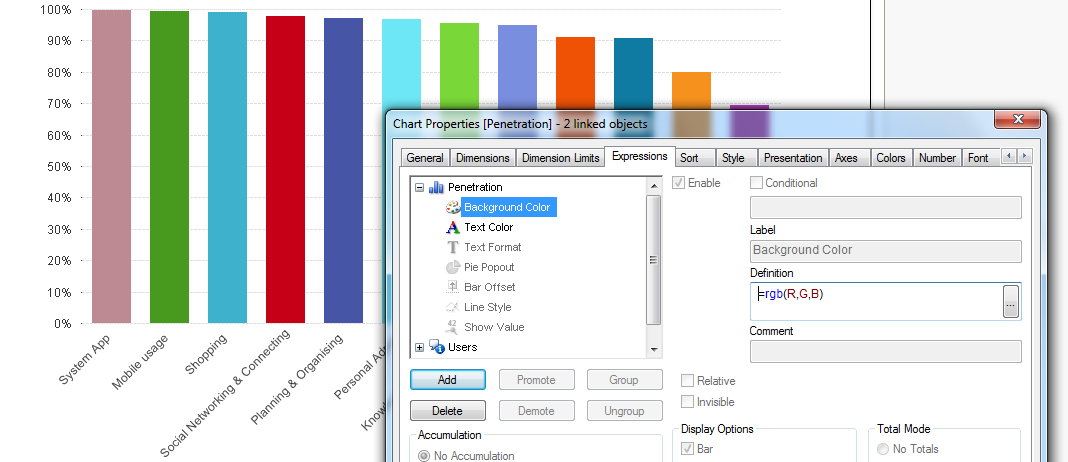
Use the options listed under the dimensions and expressions by clicking on the plus sign in front of the dimensions\expressions. Add color expressions there for text color e.g. RGB(255,0,0)
- Mark as New
- Bookmark
- Subscribe
- Mute
- Subscribe to RSS Feed
- Permalink
- Report Inappropriate Content
Another option for tables,First from the Settings\User preferences set the always show design menu

Now when you right click on a cell in the table there is a custom format cell options where you can set the borders before and after

- Mark as New
- Bookmark
- Subscribe
- Mute
- Subscribe to RSS Feed
- Permalink
- Report Inappropriate Content
Thank you for the reply!
I do not see how to apply this method to the text on the axes however. For example, in the picture you posted, if I wanted to change color of "System App" and the colors of the percentages on the Y axis.
- Mark as New
- Bookmark
- Subscribe
- Mute
- Subscribe to RSS Feed
- Permalink
- Report Inappropriate Content
You can find that in the axes tab of the chart properties
- Mark as New
- Bookmark
- Subscribe
- Mute
- Subscribe to RSS Feed
- Permalink
- Report Inappropriate Content
Ah, thank you. For some reason I didn't think to go to the Font button to get to color. Thanks!