Unlock a world of possibilities! Login now and discover the exclusive benefits awaiting you.
- Qlik Community
- :
- All Forums
- :
- QlikView App Dev
- :
- Forcing 0 Values into Line Chart
- Subscribe to RSS Feed
- Mark Topic as New
- Mark Topic as Read
- Float this Topic for Current User
- Bookmark
- Subscribe
- Mute
- Printer Friendly Page
- Mark as New
- Bookmark
- Subscribe
- Mute
- Subscribe to RSS Feed
- Permalink
- Report Inappropriate Content
Forcing 0 Values into Line Chart
Hi All,
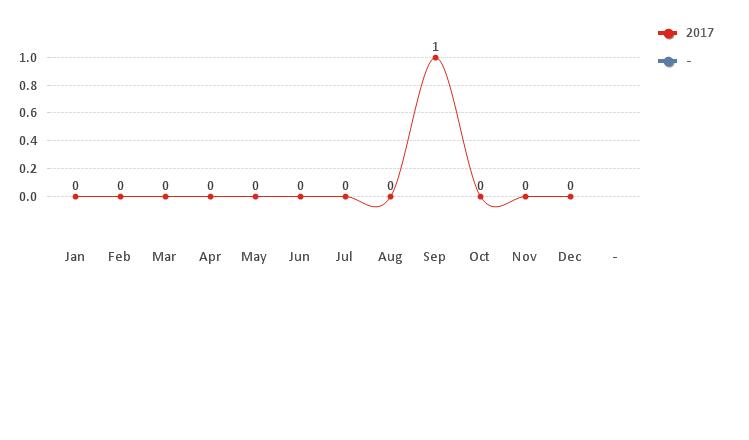
I am struggling to get a line chart of mine to show zero values.
I have tried un-ticking Suppress When Value is Null & Supress Zero Values but it still does not work.
I have a master calendar to generate missing dates in my script and need to insert these values with a 0.
The expression in the chart I have tried to do this with is below but this does not work;
=if ( count({$<FreightPaid={'Paid in UK'},INSURED={'INSURED'}>}JOBCOUNTER) > 0 , (Count({$<FreightPaid={'Paid in UK'},INSURED={'INSURED'}>}JOBCOUNTER)), 0 )
I have also been advised I can add one dummy zero record into the fact table for each month by using a calendar and concat it back to the original table but I do not know how to do this.
I have attached an example QVW.
For reference on selection of 2017 there was 1 job in Sep - I want the line chart to show 0 value for all the remaining months on one continuous line to get a better idea of the trend.
Thanks in advance.
Accepted Solutions
- Mark as New
- Bookmark
- Subscribe
- Mute
- Subscribe to RSS Feed
- Permalink
- Report Inappropriate Content
- Mark as New
- Bookmark
- Subscribe
- Mute
- Subscribe to RSS Feed
- Permalink
- Report Inappropriate Content
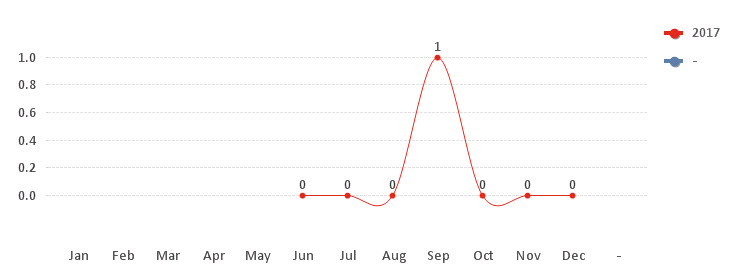
Is this what you want ?
- Mark as New
- Bookmark
- Subscribe
- Mute
- Subscribe to RSS Feed
- Permalink
- Report Inappropriate Content
Hi Thirumala,
Yes this does work a lot better thanks. However it is showing as below when I insert this into my master QVW – I think this is where the User ID has raised no jobs for the month.
I have also been advised this can be solved by using the below script beneath the Temp Calendar Script;
Concatenate(TEMP1)
load 'Paid in UK' as FreightPaid,
'Insured' as INSURED,
TempDate as [CREATION DATE],
'BALDWIN@M' as [USER CREATED BY],
1 as Dummy,
0 as JOBCOUNTER
Resident TempCalendar;
Drop Table TempCalendar;
And then using:
=sum({$<FreightPaid={'Paid in UK'},INSURED={'INSURED'}>}JOBCOUNTER)
As the expression in the chart.
This does work for my own user ID however I will need to get this to work for all User ID’s, Customers, Locations etc.
Do you know how I would do this?
Many Thanks.
- Mark as New
- Bookmark
- Subscribe
- Mute
- Subscribe to RSS Feed
- Permalink
- Report Inappropriate Content
Not 100% sure but can you give a try with the below expression:
=sum({$<FreightPaid={'Paid in UK'},INSURED={'INSURED'}>}JOBCOUNTER) * AVG(1)
- Mark as New
- Bookmark
- Subscribe
- Mute
- Subscribe to RSS Feed
- Permalink
- Report Inappropriate Content
Unfortunately this generates the same result, however it is still a lot better than what I was using previously.
Thanks for your help.