Unlock a world of possibilities! Login now and discover the exclusive benefits awaiting you.
- Qlik Community
- :
- All Forums
- :
- QlikView App Dev
- :
- Re: Formatting graphs
- Subscribe to RSS Feed
- Mark Topic as New
- Mark Topic as Read
- Float this Topic for Current User
- Bookmark
- Subscribe
- Mute
- Printer Friendly Page
- Mark as New
- Bookmark
- Subscribe
- Mute
- Subscribe to RSS Feed
- Permalink
- Report Inappropriate Content
Formatting graphs
Hi again,
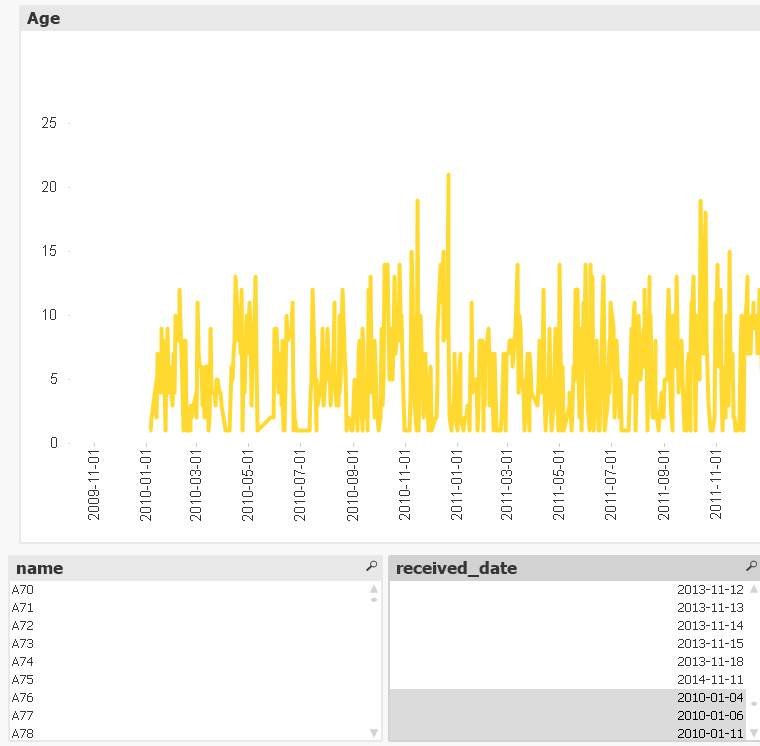
I have two questions regarding how to structure and format numbers in a graph. I am using a Line Chart for this.
1. The graph i have is filled with 0 values. That makes it look very "skippy" with the graph jumping up an down. Is there a way to smooth this graph out? I know there is a function under the Expression Tab to use the trend lines, but I dont think this gives a good enough representation.
2. I would like to input a line marking the 1200 point. This would be a vertical, static line at 1200 running through the graph. Any ideas?
Cheers,
- Mark as New
- Bookmark
- Subscribe
- Mute
- Subscribe to RSS Feed
- Permalink
- Report Inappropriate Content
haha, got it! i will watch the video now 
- Mark as New
- Bookmark
- Subscribe
- Mute
- Subscribe to RSS Feed
- Permalink
- Report Inappropriate Content
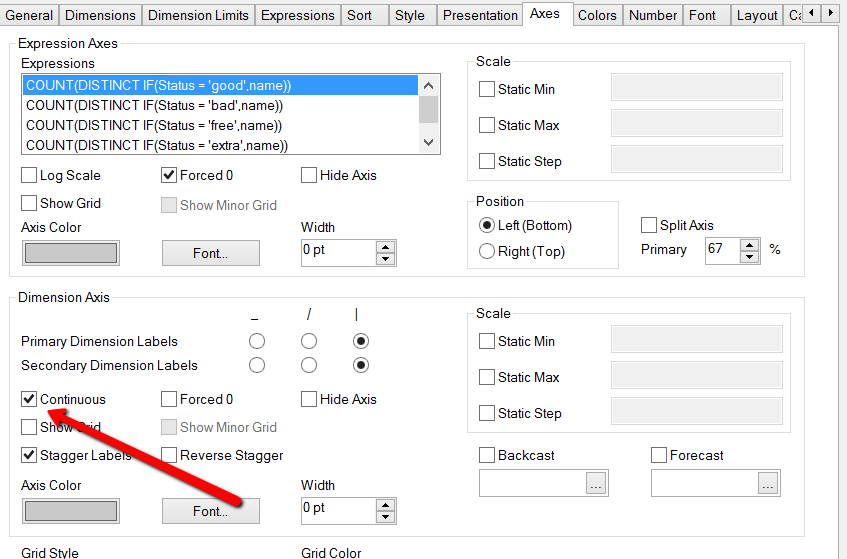
my "continues x" location box is greyed out? i am using a bar chart - may that cause issues?
- Mark as New
- Bookmark
- Subscribe
- Mute
- Subscribe to RSS Feed
- Permalink
- Report Inappropriate Content
Hi Nils,
Try ticking the box for continuous and see if that works, it does for me, however it skews the chart
- Mark as New
- Bookmark
- Subscribe
- Mute
- Subscribe to RSS Feed
- Permalink
- Report Inappropriate Content
In the first example it was available  like I suggested in my first post
- Mark as New
- Bookmark
- Subscribe
- Mute
- Subscribe to RSS Feed
- Permalink
- Report Inappropriate Content
i checked that, it skewed the chart yes, but i still didnt get it to work. are you using the same YEARSTART(TODAY()) formula as you use in your above example?
- Mark as New
- Bookmark
- Subscribe
- Mute
- Subscribe to RSS Feed
- Permalink
- Report Inappropriate Content
No,
for the expression i said =1200
- Mark as New
- Bookmark
- Subscribe
- Mute
- Subscribe to RSS Feed
- Permalink
- Report Inappropriate Content
that works, thank you. now why does the graph skew up like that? i dont want it stacked - rather grouped as it was...
- Mark as New
- Bookmark
- Subscribe
- Mute
- Subscribe to RSS Feed
- Permalink
- Report Inappropriate Content
Hi Nils,
I am looking at this too, it's obviously something to do with TODAY()-received_date
I try look at it
- Mark as New
- Bookmark
- Subscribe
- Mute
- Subscribe to RSS Feed
- Permalink
- Report Inappropriate Content
thank you. i need that type of formula however since i need the chart to be dynamically updated (since dates are going to change). the solution i though of was today()-received_date but i dont know if this is optimal?
- Mark as New
- Bookmark
- Subscribe
- Mute
- Subscribe to RSS Feed
- Permalink
- Report Inappropriate Content
Hi Nils,
the reason for the negative number is that the received_date goes beyond today. Why would you have a received date greater than today?