Unlock a world of possibilities! Login now and discover the exclusive benefits awaiting you.
- Qlik Community
- :
- All Forums
- :
- QlikView App Dev
- :
- Re: Formula in Chart
- Subscribe to RSS Feed
- Mark Topic as New
- Mark Topic as Read
- Float this Topic for Current User
- Bookmark
- Subscribe
- Mute
- Printer Friendly Page
- Mark as New
- Bookmark
- Subscribe
- Mute
- Subscribe to RSS Feed
- Permalink
- Report Inappropriate Content
Formula in Chart
Hi geniuses,
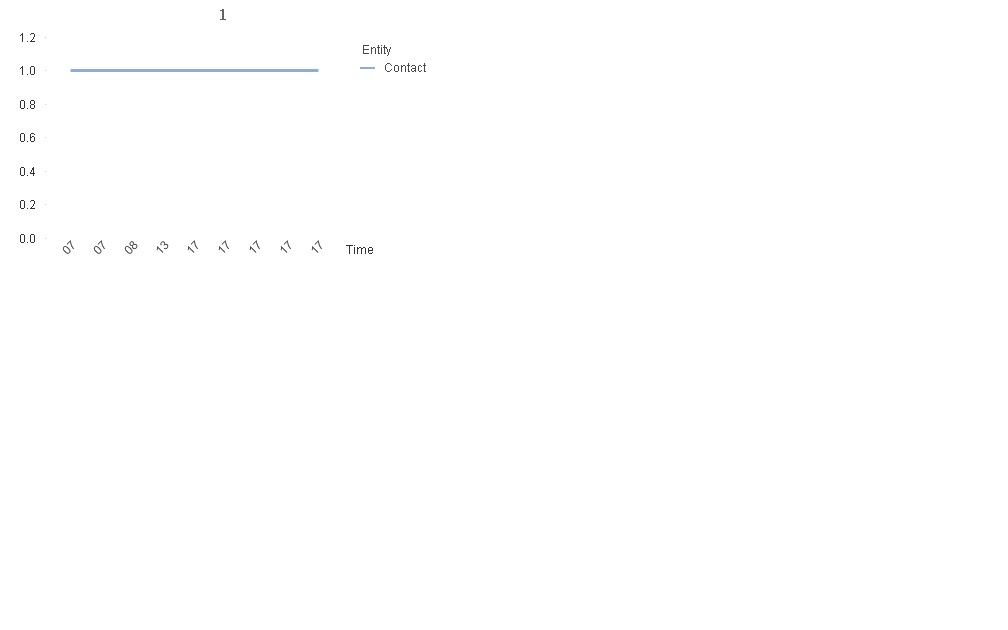
I Have a chart belo which have Entity and Time as dimension and I am using the formula =aggr(Count(Entity),Time) but it is not giving me desired result . if you see there are time coming as two times 07 one time 08 one time 13 and 5 times 17 but what I want that 07 will come only one time with count of 2 08 count should be 1 13 count should be 1 and 17 count should be 5 . Actually I want to track during which time of the day user login is most on particular entity
Please help me
Thanks in advance
Shashank
Accepted Solutions
- Mark as New
- Bookmark
- Subscribe
- Mute
- Subscribe to RSS Feed
- Permalink
- Report Inappropriate Content
Hi Shashank,
It seems that there are different values for the same time, in script try to set Text(Time) as Time
Different seconds, minutes or date may brign same hour but different internal values.
Hope this helps
- Mark as New
- Bookmark
- Subscribe
- Mute
- Subscribe to RSS Feed
- Permalink
- Report Inappropriate Content
Guys please help me please
- Mark as New
- Bookmark
- Subscribe
- Mute
- Subscribe to RSS Feed
- Permalink
- Report Inappropriate Content
Do you have a qvw document you can attach?
- Mark as New
- Bookmark
- Subscribe
- Mute
- Subscribe to RSS Feed
- Permalink
- Report Inappropriate Content
Hi Shashank,
It seems that there are different values for the same time, in script try to set Text(Time) as Time
Different seconds, minutes or date may brign same hour but different internal values.
Hope this helps
- Mark as New
- Bookmark
- Subscribe
- Mute
- Subscribe to RSS Feed
- Permalink
- Report Inappropriate Content
You are a life saver thanks alot ![]()