Unlock a world of possibilities! Login now and discover the exclusive benefits awaiting you.
- Qlik Community
- :
- All Forums
- :
- QlikView App Dev
- :
- Re: Formula/variable inside set analysis is not ca...
- Subscribe to RSS Feed
- Mark Topic as New
- Mark Topic as Read
- Float this Topic for Current User
- Bookmark
- Subscribe
- Mute
- Printer Friendly Page
- Mark as New
- Bookmark
- Subscribe
- Mute
- Subscribe to RSS Feed
- Permalink
- Report Inappropriate Content
Formula/variable inside set analysis is not calculating as per the dimension in straight table
Hi Guys,
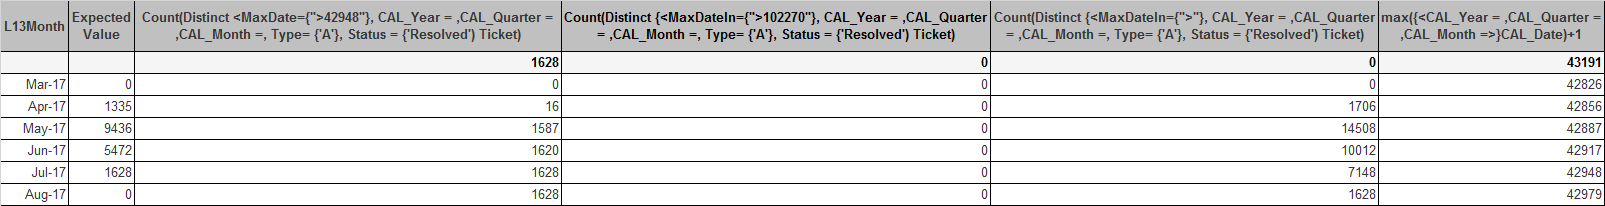
I'm making a straight table with CAL_Month as dimension and an expression to calculate the no of tickets resolved with a type 'A' and the calendar date is greater than the Maxdate using the below expression,
Count(Distinct <MaxDate={">$(=max(CAL_Date)+1)"}, CAL_Year = ,CAL_Quarter = ,CAL_Month =, Type= {'A'}, Status = {'Resolved') Ticket)
This works fine in a text box where I display the value for one month at a time (I have Year & Month filters as well in the dashboard).
But when I try to display the same value in a line chart for all months (ignoring the Month & Year selections in the dashboard) its not working fine. Because the max date is not properly calculating at CAL_Month dimension level.
I have tried below three possibilities,
Exp 2:-
Count(Distinct <MaxDate={">$(=max(CAL_Date)+1)"}, CAL_Year = ,CAL_Quarter = ,CAL_Month =, Type= {'A'}, Status = {'Resolved') Ticket)
Exp 3:-
Count(Distinct <MaxDate={">$(=max({<CAL_Year = ,CAL_Quarter = ,CAL_Month =>}CAL_Date)+1)"}, CAL_Year = ,CAL_Quarter = ,CAL_Month =, Type= {'A'}, Status = {'Resolved') Ticket)
Exp 4:-
Count(Distinct <MaxDate={">$(=aggr(max({<CAL_Year = ,CAL_Quarter = ,CAL_Month =>}CAL_Date)+1),CAL_Month)"}, CAL_Year = ,CAL_Quarter = ,CAL_Month =, Type= {'A'}, Status = {'Resolved') Ticket)
Exp 5:- Here I just pasted the max date calculation separately which is working fine, but the same is not working inside a set analysis calculation.
And these results as below,
Can you guys please help me here.
Thanks.
- « Previous Replies
-
- 1
- 2
- Next Replies »
Accepted Solutions
- Mark as New
- Bookmark
- Subscribe
- Mute
- Subscribe to RSS Feed
- Permalink
- Report Inappropriate Content
Try using nested if conditions and forcefully join the dimension with your expression like below, this may be a stupid idea but this resolves this issue.
if(L13Month = 'Jan-2018',
Count(Distinct <MaxDate={">31-01-2018"}, CAL_Year = ,CAL_Quarter = ,CAL_Month =, Type= {'A'}, Status = {'Resolved') Ticket),
if(L13Month = 'Feb-2018',
Count(Distinct <MaxDate={">28-02-2018"}, CAL_Year = ,CAL_Quarter = ,CAL_Month =, Type= {'A'}, Status = {'Resolved') Ticket),
...etc.,
Considering you have only 13 values always (L13Month) you can make it work, but if the values start increasing then it may cost in performance of the dashboard. In which case we need to think of a dynamic way of doing it.
Thanks,
Shan S
- Mark as New
- Bookmark
- Subscribe
- Mute
- Subscribe to RSS Feed
- Permalink
- Report Inappropriate Content
Looks like you have MonthYear as dimension and you are trying to get for each month year max date.
Set Expression is working once per chart. Not once per line.
So here your Max(CAL_Date) is same for all MonthYear. Don't expect that you will get different result for MaxDate = {">$(=max(CAL_Date)+1)"}
You can achieve this using Aggr and If function or creating flag for max date inside script.
Provide your sample data or sample app. We can try to help you in this case.
- Mark as New
- Bookmark
- Subscribe
- Mute
- Subscribe to RSS Feed
- Permalink
- Report Inappropriate Content
Hi Manish,
Thanks for your reply, yes you got my problem exactly.
I too tried using Aggr & if conditions like below, but I didn't get the result as expected.
if(date(aggr(max(CAL_Date)+1,CAL_MonthYear),'MM/DD/YYYY') < date(MaxDateIn,'MM/DD/YYYY'),
Count(DISTINCT {<CAL_Year = ,CAL_Quarter = ,CAL_Month =, Type= {'A'}, Status = {'Resolved'}>} Ticket),0)
Attached is the sample data I'm using for this, Please help.
Thanks.
- Mark as New
- Bookmark
- Subscribe
- Mute
- Subscribe to RSS Feed
- Permalink
- Report Inappropriate Content
Provide sample data.. Would try to help you.
- Mark as New
- Bookmark
- Subscribe
- Mute
- Subscribe to RSS Feed
- Permalink
- Report Inappropriate Content
I'm trying but not able to upload the sample data, not sure what's the issue. Is there a way to upload it.
- Mark as New
- Bookmark
- Subscribe
- Mute
- Subscribe to RSS Feed
- Permalink
- Report Inappropriate Content
- Mark as New
- Bookmark
- Subscribe
- Mute
- Subscribe to RSS Feed
- Permalink
- Report Inappropriate Content
I expect that the problem is the DISTINCT. In a text box, it will count distinct value across the entire model, and in the chart, it will take distinct values for the current month, but a value could be in multiple months. The solution is an Aggr() expression:
Sum(Aggr(
Count(Distinct <MaxDate={">$(=max(CAL_Date)+1)"}, CAL_Year = ,CAL_Quarter = ,CAL_Month =, Type= {'A'}, Status = {'Resolved') Ticket), L13Month)
(assumes that you have a single dimension in the chart, L13Month)
- Mark as New
- Bookmark
- Subscribe
- Mute
- Subscribe to RSS Feed
- Permalink
- Report Inappropriate Content
Hi Manish,
Thanks for your help, I think there is some firewall block in my network, I'm uploading a sample here from my PC.In this sample data I have covered all my scenarios.
As per this sample data below is my expected results both in text object and Line chart. And the issue is its working fine in Text object but not in Line chart since the Max(CAL_date) is not getting calculated at Line level (Month Year level).
| CAL_Year | CAL_Month | CAL_Quarter | L13M | Max(CAL_Date) | Expected result both Text object & Line chart | Comments |
| May | 2017 | Q1 | 17-May | 5/31/2017 | 8 | MaxDate > Max(CAL_Date)+1 which means tickets resolved from June onwards with Type = 'A' |
| June | 2017 | Q1 | 17-Jun | 6/30/2017 | 6 | MaxDate > Max(CAL_Date)+1 which means tickets resolved from July onwards with Type = 'A' |
| July | 2017 | Q2 | 17-Jul | 7/31/2017 | 3 | MaxDate > Max(CAL_Date)+1 which means tickets resolved from August onwards with Type = 'A' |
Please help.
- Mark as New
- Bookmark
- Subscribe
- Mute
- Subscribe to RSS Feed
- Permalink
- Report Inappropriate Content
Hi Jonathan,
Thanks for your reply.
I have already tried using sum(aggr()) at month year level (That's the only dimension I have in Chart), but still I can see the Max(CAL_Date) is calculating at overall datamodel level and not at Line level/aggr(L13Month) level.
Is there a way to force it to calculated at Line level.
Thanks.
- Mark as New
- Bookmark
- Subscribe
- Mute
- Subscribe to RSS Feed
- Permalink
- Report Inappropriate Content
Try using nested if conditions and forcefully join the dimension with your expression like below, this may be a stupid idea but this resolves this issue.
if(L13Month = 'Jan-2018',
Count(Distinct <MaxDate={">31-01-2018"}, CAL_Year = ,CAL_Quarter = ,CAL_Month =, Type= {'A'}, Status = {'Resolved') Ticket),
if(L13Month = 'Feb-2018',
Count(Distinct <MaxDate={">28-02-2018"}, CAL_Year = ,CAL_Quarter = ,CAL_Month =, Type= {'A'}, Status = {'Resolved') Ticket),
...etc.,
Considering you have only 13 values always (L13Month) you can make it work, but if the values start increasing then it may cost in performance of the dashboard. In which case we need to think of a dynamic way of doing it.
Thanks,
Shan S
- « Previous Replies
-
- 1
- 2
- Next Replies »