Unlock a world of possibilities! Login now and discover the exclusive benefits awaiting you.
- Qlik Community
- :
- All Forums
- :
- QlikView App Dev
- :
- Fractile function error
- Subscribe to RSS Feed
- Mark Topic as New
- Mark Topic as Read
- Float this Topic for Current User
- Bookmark
- Subscribe
- Mute
- Printer Friendly Page
- Mark as New
- Bookmark
- Subscribe
- Mute
- Subscribe to RSS Feed
- Permalink
- Report Inappropriate Content
Fractile function error
Hi
Attached is the sample data and app.
It has 2 expressions
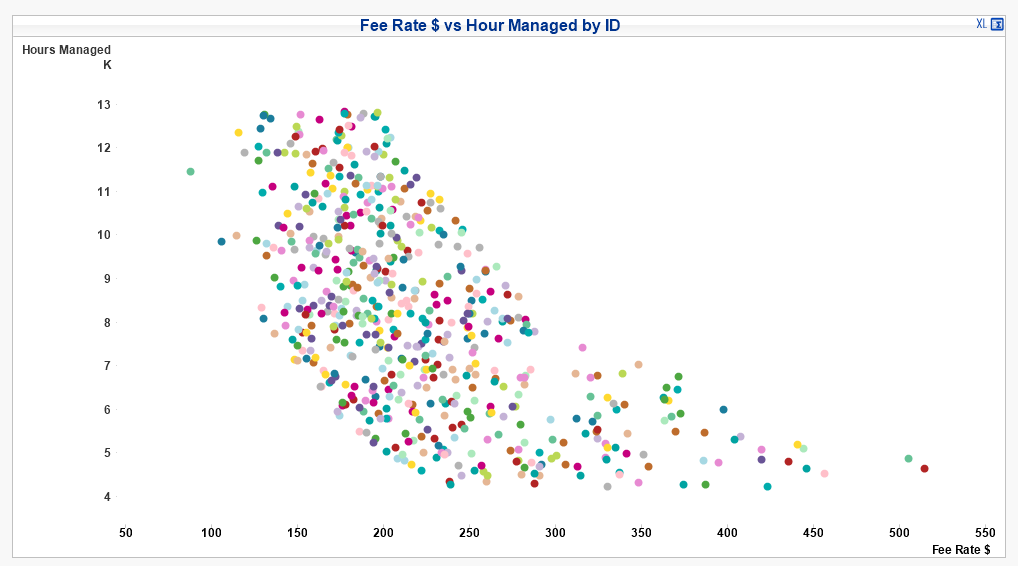
1. Revenue/Hours
2. Hours
I'm trying to display in scatter plot using dimension ID
Also the current logic is to display ID's between 5 and 95 percentile. Hence i used FRACTILE function.
However when i select random data, attached is the image and highlighted in RED, it is saying NO DATA TO DISPLAY.
Now i'm trying to get to the state of achieving between (StdDev * -0.5 + Mean) and (StdDev * 0.5 + Mean)
Please help me on the same
Thanks
Satish
Accepted Solutions
- Mark as New
- Bookmark
- Subscribe
- Mute
- Subscribe to RSS Feed
- Permalink
- Report Inappropriate Content
- Mark as New
- Bookmark
- Subscribe
- Mute
- Subscribe to RSS Feed
- Permalink
- Report Inappropriate Content
Hi Satish,
PFA
Thanks,
RT
- Mark as New
- Bookmark
- Subscribe
- Mute
- Subscribe to RSS Feed
- Permalink
- Report Inappropriate Content
Another option
Fee Rate $
(Avg({<RecordID =
{"=Avg([Fee Revenue]) >= Fractile({1} TOTAL Aggr(Avg({1} [Fee Revenue]), RecordID), 0.05) and Avg([Fee Revenue]) <= Fractile({1} TOTAL Aggr(Avg({1} [Fee Revenue]), RecordID), 0.95)"}
>}[Fee Revenue]))
/
(Avg({<RecordID =
{"=Avg([Engagement Hours]) >= Fractile({1} TOTAL Aggr(Avg({1} [Engagement Hours]), RecordID), 0.05) and Avg([Engagement Hours]) <= Fractile({1} TOTAL Aggr(Avg({1} [Engagement Hours]), RecordID), 0.95)"}
>}[Engagement Hours]))
Hours Manged
Sum({<RecordID =
{"=Sum([Engagement Hours]) >= Fractile({1} TOTAL Aggr(Sum({1} [Engagement Hours]), RecordID), 0.05) and Sum([Engagement Hours]) <= Fractile({1} TOTAL Aggr(Sum({1} [Engagement Hours]), RecordID), 0.95)"}
>}[Engagement Hours])
- Mark as New
- Bookmark
- Subscribe
- Mute
- Subscribe to RSS Feed
- Permalink
- Report Inappropriate Content
Thanks Sunny and Rajesh
Instead of restricting ID's between 5 and 95% percentile, can we restrict between
(StdDev * -0.5 + Mean) and (StdDev * 0.5 + Mean)
?
Thanks
Satish
- Mark as New
- Bookmark
- Subscribe
- Mute
- Subscribe to RSS Feed
- Permalink
- Report Inappropriate Content
This?
(Avg({<RecordID =
{"=Avg([Fee Revenue]) >= Avg({1} TOTAL Aggr(Avg({1} [Fee Revenue]), RecordID)) - (0.5 * Stdev({1} TOTAL Aggr(Avg({1} [Fee Revenue]), RecordID))) and
Avg([Fee Revenue]) <= Avg({1} TOTAL Aggr(Avg({1} [Fee Revenue]), RecordID)) + (0.5 * Stdev({1} TOTAL Aggr(Avg({1} [Fee Revenue]), RecordID)))"}
>}[Fee Revenue]))
/
(Avg({<RecordID =
{"=Avg([Engagement Hours]) >= Avg({1} TOTAL Aggr(Avg({1} [Engagement Hours]), RecordID)) - (0.5 * Stdev({1} TOTAL Aggr(Avg({1} [Engagement Hours]), RecordID))) and
Avg([Engagement Hours]) <= Avg({1} TOTAL Aggr(Avg({1} [Engagement Hours]), RecordID)) + (0.5 * Stdev({1} TOTAL Aggr(Avg({1} [Engagement Hours]), RecordID)))"}
>}[Engagement Hours]))
Sum({<RecordID =
{"=Avg([Engagement Hours]) >= Avg({1} TOTAL Aggr(Avg({1} [Engagement Hours]), RecordID)) - (0.5 * Stdev({1} TOTAL Aggr(Avg({1} [Engagement Hours]), RecordID))) and
Avg([Engagement Hours]) <= Avg({1} TOTAL Aggr(Avg({1} [Engagement Hours]), RecordID)) + (0.5 * Stdev({1} TOTAL Aggr(Avg({1} [Engagement Hours]), RecordID)))"}
>}[Engagement Hours])
- Mark as New
- Bookmark
- Subscribe
- Mute
- Subscribe to RSS Feed
- Permalink
- Report Inappropriate Content
Hi Sunny
Thanks for the logic.
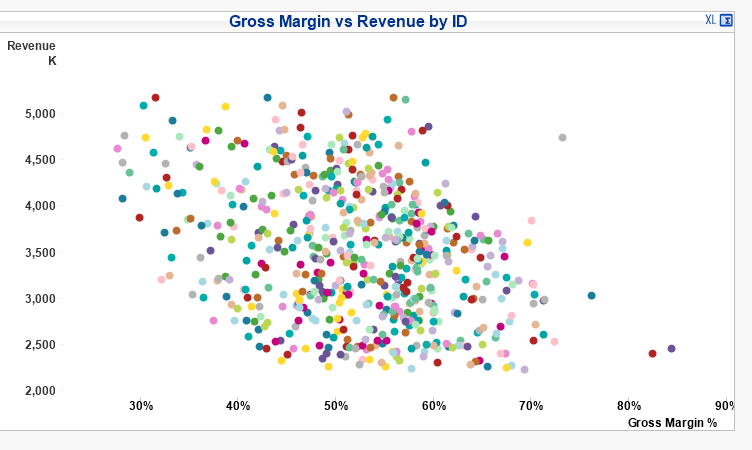
I applied this logic to Revenue vs GM % and now i see Revenue values showing as Zero for few ID's
Example: ID 980 (Attached screenshot for the bubble 980 in chart)
Attaching the latest app, data and screenshot
Thanks
Satish !
- Mark as New
- Bookmark
- Subscribe
- Mute
- Subscribe to RSS Feed
- Permalink
- Report Inappropriate Content
I guess Gross Margin % is using Fee Revenue and Revenue is using Engagement Revenue.... you need to decide which confidence interval you want to go with... you seem to have a different RecordID picked based on different expression. I won't know what the final goal is until you explain it clearly.
- Mark as New
- Bookmark
- Subscribe
- Mute
- Subscribe to RSS Feed
- Permalink
- Report Inappropriate Content
HI Sunny
thanks for the response.
the goal is to distribute the bubbles evenly instead of making it close to axes where all bubbles sit close to axes.
FFee Rate chart is distributed evenly. But if I take gross margin vs revenue for few ids revenue is zero.
DDoes it make sense now?
thanks
satish
- Mark as New
- Bookmark
- Subscribe
- Mute
- Subscribe to RSS Feed
- Permalink
- Report Inappropriate Content
I am still not sure I understand... but try the attached
- Mark as New
- Bookmark
- Subscribe
- Mute
- Subscribe to RSS Feed
- Permalink
- Report Inappropriate Content
Hi Sunny
Thank you very much for this.
I implemented this change and waiting for feedback from client.
I will update you if any issues.
I'm closing this as correct answer as the results are satisfactory and correct
Thanks
Satish