Unlock a world of possibilities! Login now and discover the exclusive benefits awaiting you.
- Qlik Community
- :
- All Forums
- :
- QlikView App Dev
- :
- Fractile rounding
- Subscribe to RSS Feed
- Mark Topic as New
- Mark Topic as Read
- Float this Topic for Current User
- Bookmark
- Subscribe
- Mute
- Printer Friendly Page
- Mark as New
- Bookmark
- Subscribe
- Mute
- Subscribe to RSS Feed
- Permalink
- Report Inappropriate Content
Fractile rounding
Hi folks.
I'm often looking to these forums to get my Qlik questions answered, but could not find any appropriate solution for below one.
I'm using Fractile to measure some SLA performance & never get appropriate rounding beyond the integer digits.
as an example, see below data
load * inline [
TAT , item
2 , A
2 , B
3 , C
3 , D
3 , E
3 , F
3 , G
3 , H
3 , I
3 , J
4 , K
4 , L
10 , M
]
fractile (TAT, 0.9) returns 4.0 where it should be 3.5
strange enough, changing one data (4,L to 5,L) as below,
fractile (TAT, 0.9) returns 4.8, which is correct
load * inline [
TAT , item
2 , A
2 , B
3 , C
3 , D
3 , E
3 , F
3 , G
3 , H
3 , I
3 , J
5 , K
4 , L
10 , M
]
what am I doing wrong??
Accepted Solutions
- Mark as New
- Bookmark
- Subscribe
- Mute
- Subscribe to RSS Feed
- Permalink
- Report Inappropriate Content
- Mark as New
- Bookmark
- Subscribe
- Mute
- Subscribe to RSS Feed
- Permalink
- Report Inappropriate Content
- Mark as New
- Bookmark
- Subscribe
- Mute
- Subscribe to RSS Feed
- Permalink
- Report Inappropriate Content
See my response here:
Re: What is the exactly calculation of the fractile function?
- Mark as New
- Bookmark
- Subscribe
- Mute
- Subscribe to RSS Feed
- Permalink
- Report Inappropriate Content
If you look at Fractile X% I have, you will see that based on your first data set,
Fractile 90% = (13 * 0.90) + (1-0.90) = 11.8 -> This means 11th Observation + (12th - 11th Observation) * 0.8
11th obersvation = 4
12th observation = 4
So, 4 + ((4-4)* 8/10) = 4
The second dataset
11th observation = 4
12 obervation = 5
So, 4 + ((5-4) * 8/10) = 4.8
- Mark as New
- Bookmark
- Subscribe
- Mute
- Subscribe to RSS Feed
- Permalink
- Report Inappropriate Content
Sunny,
Thank you, the mystery is revealed.
Now, the value I'd like to compute is the below aggregated analysis.
back on 1st dataset, this shows 15% with TAT 2, 62% with TAT 3,...
| TAT | % of items |
| 2 | 15% |
| 3 | 62% |
| 4 | 15% |
| 10 | 8% |
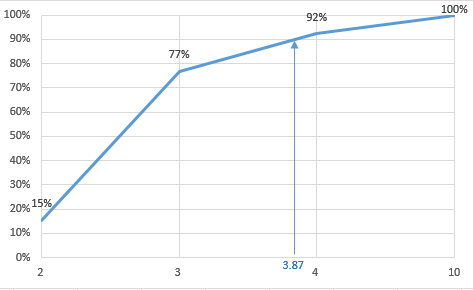
projecting a pareto as below, we see 90% meeting theoretical TAT of 3.87.
I know this is not a coherent statistical value, but do you know how this can be calculated in a Qlikview chart?
thank you
- Mark as New
- Bookmark
- Subscribe
- Mute
- Subscribe to RSS Feed
- Permalink
- Report Inappropriate Content
Would you be able to share how you came up with this number? I am not sure I follow completely
- Mark as New
- Bookmark
- Subscribe
- Mute
- Subscribe to RSS Feed
- Permalink
- Report Inappropriate Content
from below data
TAT , item
2 , A
2 , B
3 , C
3 , D
3 , E
3 , F
3 , G
3 , H
3 , I
3 , J
4 , K
4 , L
10 , M
I pivot this data, counting % number of items per TAT.
| TAT | % of items | cumulative % of items |
| 2 | 15% | 15% |
| 3 | 62% | 77% |
| 4 | 15% | 92% |
| 10 | 8% | 100% |
Then, I find 77% at 3, 92% at 4 & then extrapolate 90% as 3 + ((90% - 77%) / (92% - 77%)) = 3.87
- Mark as New
- Bookmark
- Subscribe
- Mute
- Subscribe to RSS Feed
- Permalink
- Report Inappropriate Content
Not a nice looking expression, but may be this
=Max(Aggr(If(RangeSum(Above(Count(item), 0, RowNo()))/Count(TOTAL item) <= 0.90, TAT), TAT)) +
((0.90 - Max(Aggr(If(RangeSum(Above(Count(item), 0, RowNo()))/Count(TOTAL item) <= 0.90, RangeSum(Above(Count(item), 0, RowNo()))/Count(TOTAL item)), TAT))) /
(Min(Aggr(If(RangeSum(Above(Count(item), 0, RowNo()))/Count(TOTAL item) > 0.90, RangeSum(Above(Count(item), 0, RowNo()))/Count(TOTAL item)), TAT)) - Max(Aggr(If(RangeSum(Above(Count(item), 0, RowNo()))/Count(TOTAL item) <= 0.90, RangeSum(Above(Count(item), 0, RowNo()))/Count(TOTAL item)), TAT))))
Also, this is highly dependent on the fact that how your TAT field is sorted.... if it isn't sorted in Ascending order, the expression won't work as is. To fix that, either you will have to sort the TAT field in the script or you can use The sortable Aggr function is finally here! which is available in QV12 or Qlik Sense.
- Mark as New
- Bookmark
- Subscribe
- Mute
- Subscribe to RSS Feed
- Permalink
- Report Inappropriate Content
thank you Sunny. it works well with my database correctly sorted. I'll look at the sortable aggr to see if I can leverage.
thank you again