Unlock a world of possibilities! Login now and discover the exclusive benefits awaiting you.
- Qlik Community
- :
- All Forums
- :
- QlikView App Dev
- :
- Re: Funnel Chart Expression Problem
- Subscribe to RSS Feed
- Mark Topic as New
- Mark Topic as Read
- Float this Topic for Current User
- Bookmark
- Subscribe
- Mute
- Printer Friendly Page
- Mark as New
- Bookmark
- Subscribe
- Mute
- Subscribe to RSS Feed
- Permalink
- Report Inappropriate Content
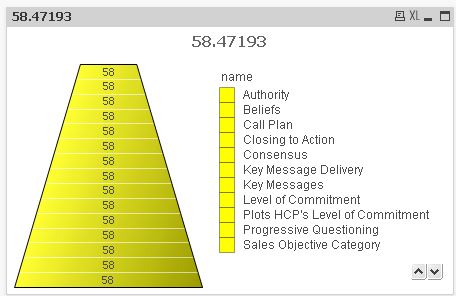
Funnel Chart Expression Problem
Hello,
PFA.
I have one excel which is 2014 Data. Now, i want to split three parts.
1) Whoever more than 70
2) In between of 50 & 70
3) Below 50
Can you please help me This...
- « Previous Replies
-
- 1
- 2
- Next Replies »
Accepted Solutions
- Mark as New
- Bookmark
- Subscribe
- Mute
- Subscribe to RSS Feed
- Permalink
- Report Inappropriate Content
Use Calculated Dimension as below
=Aggr(If($(vAverage) < 50, '<50',
If($(vAverage) > 70, '>70',
'50-70')),name)
Expression
COUNT(Distinct name)
- Mark as New
- Bookmark
- Subscribe
- Mute
- Subscribe to RSS Feed
- Permalink
- Report Inappropriate Content
Use Calculated Dimension as below
=Aggr(If($(vAverage) < 50, '<50',
If($(vAverage) > 70, '>70',
'50-70')),name)
Expression
COUNT(Distinct name)
- Mark as New
- Bookmark
- Subscribe
- Mute
- Subscribe to RSS Feed
- Permalink
- Report Inappropriate Content
Or
Use your same funnel chart
Go to Expression tab
Click on + sign of expression
Background color
Use below as background color expression
=If($(vAverage) < 50, RED(),
If($(vAverage) > 70, Green(),
RGB(100,100,100)))
- Mark as New
- Bookmark
- Subscribe
- Mute
- Subscribe to RSS Feed
- Permalink
- Report Inappropriate Content
Hi,
Use the following expression in color tab
if(Your Expression>=70, rgb(100,100,100),if(Your Expression>=50 And Your Expression<70, rgb(50,50,50),rgb(25,25,25)))
Regards
Nilanjan
- Mark as New
- Bookmark
- Subscribe
- Mute
- Subscribe to RSS Feed
- Permalink
- Report Inappropriate Content
Manish,
Yes, Here i want to show the data
1) <20
2) >=20 and <40
3) >=40 and <60
4) >=60
PFA of excel, Please find my data of 2014 & 2015.
Updated : PFA of qvw - In that, Funnel sheet
- Mark as New
- Bookmark
- Subscribe
- Mute
- Subscribe to RSS Feed
- Permalink
- Report Inappropriate Content
Hi Anil,
Your Expression has return the same value that's why all colours are same,
I have used this below expression for conditional color.
Expression: =if(vAverage>70,Red(),if(vAverage>50 and vAverage<70,Yellow(),Green()))
Susovan
- Mark as New
- Bookmark
- Subscribe
- Mute
- Subscribe to RSS Feed
- Permalink
- Report Inappropriate Content
Susovan,
Yes, That's why i posted raw data as well. can you please have a look which i provide the above one.
- Anil
- Mark as New
- Bookmark
- Subscribe
- Mute
- Subscribe to RSS Feed
- Permalink
- Report Inappropriate Content
What output you are expecting?
- Mark as New
- Bookmark
- Subscribe
- Mute
- Subscribe to RSS Feed
- Permalink
- Report Inappropriate Content
I am expecting four colors from Funnel chart, It seems the your first reply. But, i want to show those four colors which i mention in the above limits
- Mark as New
- Bookmark
- Subscribe
- Mute
- Subscribe to RSS Feed
- Permalink
- Report Inappropriate Content
=If($(vAverage) < 20, RED(),
IF($(vAverage) >= 20 and $(vAverage) < 40, RGB(100,100,100),
IF($(vAverage) >= 40 and $(vAverage) < 60, RGB(10,60,200),
If($(vAverage) >= 60, Green()))))
- « Previous Replies
-
- 1
- 2
- Next Replies »