Unlock a world of possibilities! Login now and discover the exclusive benefits awaiting you.
- Qlik Community
- :
- All Forums
- :
- QlikView App Dev
- :
- Funnel chart
- Subscribe to RSS Feed
- Mark Topic as New
- Mark Topic as Read
- Float this Topic for Current User
- Bookmark
- Subscribe
- Mute
- Printer Friendly Page
- Mark as New
- Bookmark
- Subscribe
- Mute
- Subscribe to RSS Feed
- Permalink
- Report Inappropriate Content
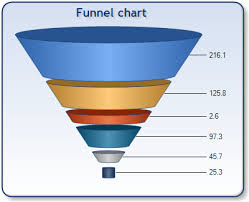
Funnel chart
Hi All,
Where can i use this chart in data model?
Thanks in advance.
- Mark as New
- Bookmark
- Subscribe
- Mute
- Subscribe to RSS Feed
- Permalink
- Report Inappropriate Content
Hi,
According to this: Funnel Chart - A Complete Guide | FusionCharts
The Funnel chart is used to visualize the progressive reduction of data as it passes from one phase to another. Data in each of these phases is represented as different portions of 100% (the whole). Like the Pie chart, the Funnel chart does not use any axes either.
The most common use of the Funnel chart is in visualizing sales conversion data.
Regards,
Sorin
- Mark as New
- Bookmark
- Subscribe
- Mute
- Subscribe to RSS Feed
- Permalink
- Report Inappropriate Content
Funnel chart is similar to your pie chart which instead shows in the form of a workflow or process.
This is best used when you have 1 dimension and 1 expression, can shows in 3 different segments.
Thanks,
Sai
- Mark as New
- Bookmark
- Subscribe
- Mute
- Subscribe to RSS Feed
- Permalink
- Report Inappropriate Content
This is a classical grafh type for have forcasting sales.
Funnel charts are a type of chart, often used to represent stages in a sales process[1] and show the amount of potential revenue for each stage. This type of chart can also be useful in identifying potential problem areas in an organization’s sales processes. A funnel chart is similar to a stacked percent bar chart.
- Mark as New
- Bookmark
- Subscribe
- Mute
- Subscribe to RSS Feed
- Permalink
- Report Inappropriate Content
How can you use an object in data model.
Funnel chart is an object for visualisation.
- Mark as New
- Bookmark
- Subscribe
- Mute
- Subscribe to RSS Feed
- Permalink
- Report Inappropriate Content
Dear Mr. Rajesht,
Funnel Chart is mostly used for sales, in which we shows the sales process phases.
Or
We use Funnel Chart for filtration or measurement process such as, in which step purchase order exist, social media measurement.
Kind regards,
Ishfaque Ahmed