Unlock a world of possibilities! Login now and discover the exclusive benefits awaiting you.
- Qlik Community
- :
- All Forums
- :
- QlikView App Dev
- :
- Re: Gap between bars in Bar Chart
- Subscribe to RSS Feed
- Mark Topic as New
- Mark Topic as Read
- Float this Topic for Current User
- Bookmark
- Subscribe
- Mute
- Printer Friendly Page
- Mark as New
- Bookmark
- Subscribe
- Mute
- Subscribe to RSS Feed
- Permalink
- Report Inappropriate Content
Gap between bars in Bar Chart
Hi,
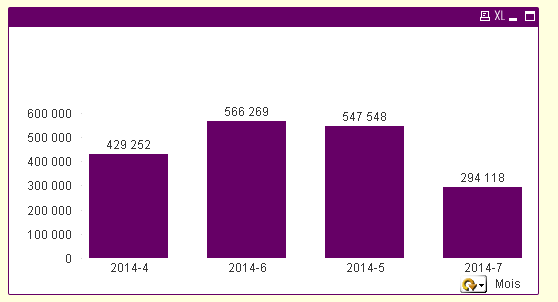
I have a bar chart and would like the gaps between the bars values to appear.
For example, in the attachment, the first 2 bars have 429 252 and 566 269 as values.
I would to show he gap between ( 566 269 - 429 252 ) , 137 017.
Since the dimension is a group, it has to be dynamic ( between monthes, weeks or days..)
Is it possible?
Thanks,
Yael
Accepted Solutions
- Mark as New
- Bookmark
- Subscribe
- Mute
- Subscribe to RSS Feed
- Permalink
- Report Inappropriate Content
maybe using a combo chart instead of just a bar chart. An additional expression2 shown as a line could calculate the changes of your bar expression1 if defined like =expression1 - above(expression1).
hope this helps
regards
Marco
- Mark as New
- Bookmark
- Subscribe
- Mute
- Subscribe to RSS Feed
- Permalink
- Report Inappropriate Content
Hi,
Can you attach your sample data ??
- Mark as New
- Bookmark
- Subscribe
- Mute
- Subscribe to RSS Feed
- Permalink
- Report Inappropriate Content
Hi,
Bar chart -> presentaion tab ->Cluster Distance->8
Hope this helps.
Dharma
- Mark as New
- Bookmark
- Subscribe
- Mute
- Subscribe to RSS Feed
- Permalink
- Report Inappropriate Content
Hi Dharma,
I don't want the distance between the bars to be changed, I want that the difference between the values will be shown.
Thanks.
- Mark as New
- Bookmark
- Subscribe
- Mute
- Subscribe to RSS Feed
- Permalink
- Report Inappropriate Content
maybe using a combo chart instead of just a bar chart. An additional expression2 shown as a line could calculate the changes of your bar expression1 if defined like =expression1 - above(expression1).
hope this helps
regards
Marco
- Mark as New
- Bookmark
- Subscribe
- Mute
- Subscribe to RSS Feed
- Permalink
- Report Inappropriate Content
Thanks a lot, that works! I didn't know the "above" function.