Unlock a world of possibilities! Login now and discover the exclusive benefits awaiting you.
- Qlik Community
- :
- All Forums
- :
- QlikView App Dev
- :
- Re: Gauge Chart?
- Subscribe to RSS Feed
- Mark Topic as New
- Mark Topic as Read
- Float this Topic for Current User
- Bookmark
- Subscribe
- Mute
- Printer Friendly Page
- Mark as New
- Bookmark
- Subscribe
- Mute
- Subscribe to RSS Feed
- Permalink
- Report Inappropriate Content
Gauge Chart?
Hello Community,
I want gauge chart to be shown like below.I have tried but couldn't get it.
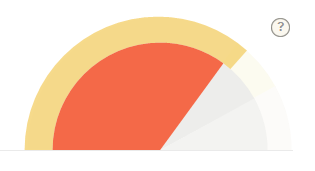
how can i do this?
Thanks
Amarnath
- Tags:
- new_to_qlikview
Accepted Solutions
- Mark as New
- Bookmark
- Subscribe
- Mute
- Subscribe to RSS Feed
- Permalink
- Report Inappropriate Content
Hi all,
I have got it by keeping Cylinder Thickness to 0,Angel Span=180 and Center Angle=0,
It gives me the same chart as i needed.
thanks u all for your efforts .
- Mark as New
- Bookmark
- Subscribe
- Mute
- Subscribe to RSS Feed
- Permalink
- Report Inappropriate Content
The only way is to create Bigger doughnut chart and then add PieChart inside and cover both with a Text object
- Mark as New
- Bookmark
- Subscribe
- Mute
- Subscribe to RSS Feed
- Permalink
- Report Inappropriate Content
Hi,
In my image attached its a two gauge chart and i want the same.
Thanks
Amarnath
- Mark as New
- Bookmark
- Subscribe
- Mute
- Subscribe to RSS Feed
- Permalink
- Report Inappropriate Content
what are you trying to acheieve with the 2 gauge charts
does the inner and out represent something different?
does it have to be a gauge - would a pie chart with 2 diemsnions work?
- Mark as New
- Bookmark
- Subscribe
- Mute
- Subscribe to RSS Feed
- Permalink
- Report Inappropriate Content
have you checked this post?
Dislike gauge charts? You may want to give them a second chance
- Mark as New
- Bookmark
- Subscribe
- Mute
- Subscribe to RSS Feed
- Permalink
- Report Inappropriate Content
I want to compare the YTD and LYTD outer gauge is LYTD and inner is YTD
- Mark as New
- Bookmark
- Subscribe
- Mute
- Subscribe to RSS Feed
- Permalink
- Report Inappropriate Content
maybe two gauge charts at the same spot but with layer depth top and bottom. do you have sample data?
- Mark as New
- Bookmark
- Subscribe
- Mute
- Subscribe to RSS Feed
- Permalink
- Report Inappropriate Content
Hi all,
I have got it by keeping Cylinder Thickness to 0,Angel Span=180 and Center Angle=0,
It gives me the same chart as i needed.
thanks u all for your efforts .