Unlock a world of possibilities! Login now and discover the exclusive benefits awaiting you.
- Qlik Community
- :
- All Forums
- :
- QlikView App Dev
- :
- Re: Gauge chart showing status
- Subscribe to RSS Feed
- Mark Topic as New
- Mark Topic as Read
- Float this Topic for Current User
- Bookmark
- Subscribe
- Mute
- Printer Friendly Page
- Mark as New
- Bookmark
- Subscribe
- Mute
- Subscribe to RSS Feed
- Permalink
- Report Inappropriate Content
Gauge chart showing status
Hello everyone,
I have a requirement to create Gauge Chart showing status ,now Status is of either OPEN or CLOSED
so I have expression count(Status), thn I set
Segment 1 lower bound as =count( {$<STATUS= "OPEN"}>}, STATUS)
Segment 2 lower bound as "=count( {$<STATUS= "CLOSED"}>}, STATUS
Is this correct?
Should I make two gauge charts one for OPEN n other for CLOSED.
I have no clue about gauge speedometers
Please help
TIA
- Mark as New
- Bookmark
- Subscribe
- Mute
- Subscribe to RSS Feed
- Permalink
- Report Inappropriate Content
You can try something like this
- Mark as New
- Bookmark
- Subscribe
- Mute
- Subscribe to RSS Feed
- Permalink
- Report Inappropriate Content
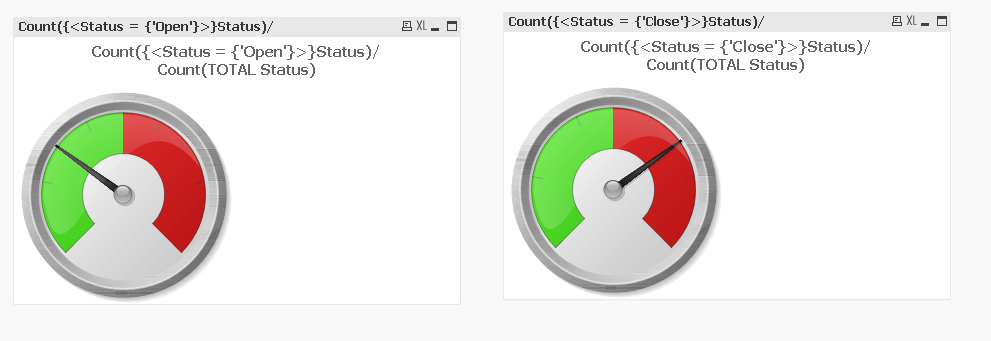
would put only one expression as relative value,
i.e. COUNT(IF(Status = 'CLOSED', Status)) / COUNT(TOTAL Status)
Leave the initial segments 1 and 2 as before betw 0 and 1.
Peter
Edith says: Neelam was faster
- Mark as New
- Bookmark
- Subscribe
- Mute
- Subscribe to RSS Feed
- Permalink
- Report Inappropriate Content
Thanks Neelam. Didi same . can u guide to make speedometer look nice n eye catching
- Mark as New
- Bookmark
- Subscribe
- Mute
- Subscribe to RSS Feed
- Permalink
- Report Inappropriate Content
Here are a couple of options.
These designs include two objects overlapped on each other.
Hope this helps.
- Mark as New
- Bookmark
- Subscribe
- Mute
- Subscribe to RSS Feed
- Permalink
- Report Inappropriate Content
Thanks Neelam, Really helpful.
I have an issue now, I created two gauge on efor OPEN n other for CLOSED.
BUt client want to see both open n closed in one speedometer only
In which it should start from 0 to count(status) and open should come in red and closed in green .
Any idea how can I show both in one
TIA
- Mark as New
- Bookmark
- Subscribe
- Mute
- Subscribe to RSS Feed
- Permalink
- Report Inappropriate Content
I don't think it make sense (but obviously I might be wrong).
Guage Charts basically represents 'where' your value of a calculation lies after setting your min & max value.
You might consider other chart type if you want to achieve this may be like pie chart.
- Mark as New
- Bookmark
- Subscribe
- Mute
- Subscribe to RSS Feed
- Permalink
- Report Inappropriate Content
Thanks ya. But they don't want pie or bar. Something fancy they need.
- Mark as New
- Bookmark
- Subscribe
- Mute
- Subscribe to RSS Feed
- Permalink
- Report Inappropriate Content