Unlock a world of possibilities! Login now and discover the exclusive benefits awaiting you.
- Qlik Community
- :
- All Forums
- :
- QlikView App Dev
- :
- Generate Country and State Numbers based on Region...
- Subscribe to RSS Feed
- Mark Topic as New
- Mark Topic as Read
- Float this Topic for Current User
- Bookmark
- Subscribe
- Mute
- Printer Friendly Page
- Mark as New
- Bookmark
- Subscribe
- Mute
- Subscribe to RSS Feed
- Permalink
- Report Inappropriate Content
Generate Country and State Numbers based on Region numbers
Hello all,
I have my data as in the Excel attached.
Overview:
Basically, i have a Month, StateID and RegionID corresponding to the State along with the Visit IDs and the Number of Products as KPIs.
Now, i want to use this KPIs(Visit ID and ProductSum) and generate 4 new columns.
- Count of Visits per State
- Sum of Products per State
- Counts of Visits on Whole(i.e, Country)
- Sum of Products on Whole(i.e, Country)
Please, see the attached Excel to get a more detail overview and expected result.
I want to do this at script level and store the values in a qvd.
NOTE:
Visits is always count and Products is always Sum.
- Mark as New
- Bookmark
- Subscribe
- Mute
- Subscribe to RSS Feed
- Permalink
- Report Inappropriate Content
HI,
try like this
Total Visits Region
Count( total <[Region ID],Month> distinct [Visit ID])
Sum of Products Region
sum( total <[Region ID],Month> [Total Products])
- Mark as New
- Bookmark
- Subscribe
- Mute
- Subscribe to RSS Feed
- Permalink
- Report Inappropriate Content
Hi,
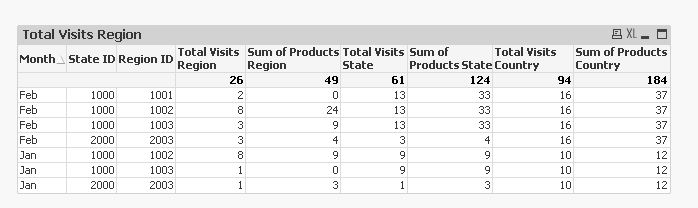
refer to the attached output. it's similar to sql group by class with count & sum function
Total Visits Region
Count( total <[Region ID],Month> distinct [Visit ID])
Sum of Products Region
sum( total <[Region ID],Month> [Total Products])
Total Visits State
Count( total <[State ID],Month> distinct [Visit ID])
Sum of Products State
sum( total <[State ID],Month> [Total Products])
Total Visits Country
Count( total <Month> distinct [Visit ID])
Sum of Products Country
sum( total <Month> [Total Products])
Close your thread by marking as correct.
Thanks,
Deva
- Mark as New
- Bookmark
- Subscribe
- Mute
- Subscribe to RSS Feed
- Permalink
- Report Inappropriate Content
Thanks for the suggestion but, i want to generate this at the script level not at the application level using Set Analysis.
- Mark as New
- Bookmark
- Subscribe
- Mute
- Subscribe to RSS Feed
- Permalink
- Report Inappropriate Content
Hello All,
Anyone here faced a similar situation before hand?
- Mark as New
- Bookmark
- Subscribe
- Mute
- Subscribe to RSS Feed
- Permalink
- Report Inappropriate Content
For every expression you have to load the same table multiple time with respected granularity.
for example
1: If you want calculate sum of Products on Whole Month wise and Counts of Visits on Whole(i.e, Country)
then
Load Month,
Sum([Total Products]) as sum_of_products_month_wise,
count(Distinct [Visit ID]) as count_of_visit_id_whole_month_wise
from Data.xlsx
group by Month;
Regards,
Please appreciate our Qlik community members by giving Kudos for sharing their time for your query. If your query is answered, please mark the topic as resolved 🙂
- Mark as New
- Bookmark
- Subscribe
- Mute
- Subscribe to RSS Feed
- Permalink
- Report Inappropriate Content
Hi,
you want these function in script level only.Try this
Load Visit ID
Group by Region as Total_visits_Region,
Visit ID group by state as Total_visits_state,
Visit ID group by country as Total_visits_country,
sum(Total Products) group by Region as sum_of_total_products_region,
sum(Total Products ) group by state as sum_of_total_products_state,
sum(Total products) Group by country as sum_of_total_products_country
Resident (above table name);
Drop table (above table);
- Mark as New
- Bookmark
- Subscribe
- Mute
- Subscribe to RSS Feed
- Permalink
- Report Inappropriate Content
Load Visit ID
Group by Region as Total_visits_Region,
Visit ID group by state as Total_visits_state,count(Total_visits_state),
Visit ID group by country as Total_visits_country,count(Total_visits_country)
sum(Total Products) group by Region as sum_of_total_products_region,
sum(Total Products ) group by state as sum_of_total_products_state,
sum(Total products) Group by country as sum_of_total_products_country
Resident (above table name);
Drop table (above table);
- Mark as New
- Bookmark
- Subscribe
- Mute
- Subscribe to RSS Feed
- Permalink
- Report Inappropriate Content
Hello All,
Thanks for the suggestions. This is turning out to be a bit more complicated than it seems to be. I have made a sample app and also a few screen shots below to explain better.
For Ex:
In the month Jan i should see the following Numbers for those particular selections
Country - 10 Visits(Count OF Distinct Visit ID) and 12 Products(Sum of Total Products) - Irrespective of selection
State 1000 - 9 Visits and 9 Products - When State 1000 is selected
Region 1002 - 8 Visits and 9 Products - When Region 1002 is selected
But, if you see the application it gives me some completely different numbers.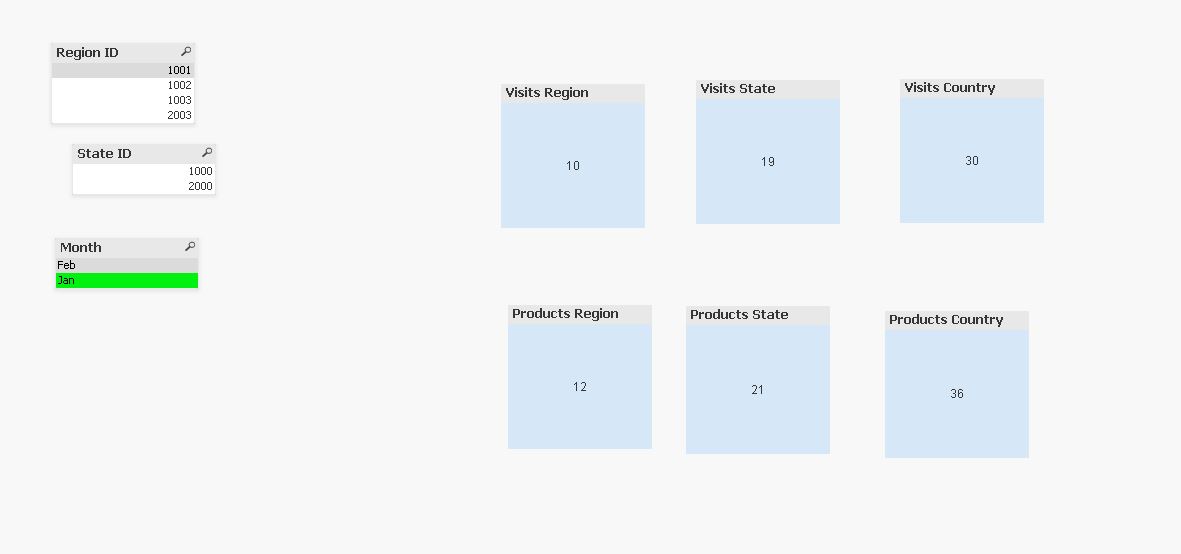
The Country Numbers should not Respond if a State or Region is selected and the State numbers should not respond if a Region is selected.
Please, provide your valuable suggestions.