Unlock a world of possibilities! Login now and discover the exclusive benefits awaiting you.
- Qlik Community
- :
- All Forums
- :
- QlikView App Dev
- :
- Geographical heat map using Google chart API - '&c...
- Subscribe to RSS Feed
- Mark Topic as New
- Mark Topic as Read
- Float this Topic for Current User
- Bookmark
- Subscribe
- Mute
- Printer Friendly Page
- Mark as New
- Bookmark
- Subscribe
- Mute
- Subscribe to RSS Feed
- Permalink
- Report Inappropriate Content
Geographical heat map using Google chart API - '&chd=s:' parameter wrong display
I made some modification on the file GoogleMpaChart of Rob Wunderlich to adapt it on Romanian map but I got stuck on 'chd=s:' parameter
& '&chd=s:' & concat( aggr( mid('$(simpleEncodingMap)', 1+round(61*sum(Sales)/max(TOTAL aggr(DISTINCT sum(Sales), ISO2)),1),1), ISO2), '', fieldIndex('ISO2', ISO2) )
The map is showing but the dates are not corect.
Some help it would be apreciated or detailed of the function of aggr( mid('$(simpleEncodingMap)', 1+round(61*sum(Sales)/max(TOTAL aggr(DISTINCT sum(Sales), ISO2)),1),1), ISO2),
ps: ISO2 - code ISO 3166-2 for region adm
- Mark as New
- Bookmark
- Subscribe
- Mute
- Subscribe to RSS Feed
- Permalink
- Report Inappropriate Content
Hi,
Fyi, geographical heat maps like this is easy to build with our map extension: IdevioMaps for Qlikview. All configuration is done with expressions, no javascripting or url construction is needed. It's also possible to zoom and pan the map to explore the selection.

Idevio is a QlikTech Technology partner since 2009 and our maps are currently featured both at QlikMarket and at QlikDemos. Of course, I would be happy to provide eval licenses anyone should be interested.
Thanks,
Patric patric.nordstrom@idevio.com
- Mark as New
- Bookmark
- Subscribe
- Mute
- Subscribe to RSS Feed
- Permalink
- Report Inappropriate Content
Hi,
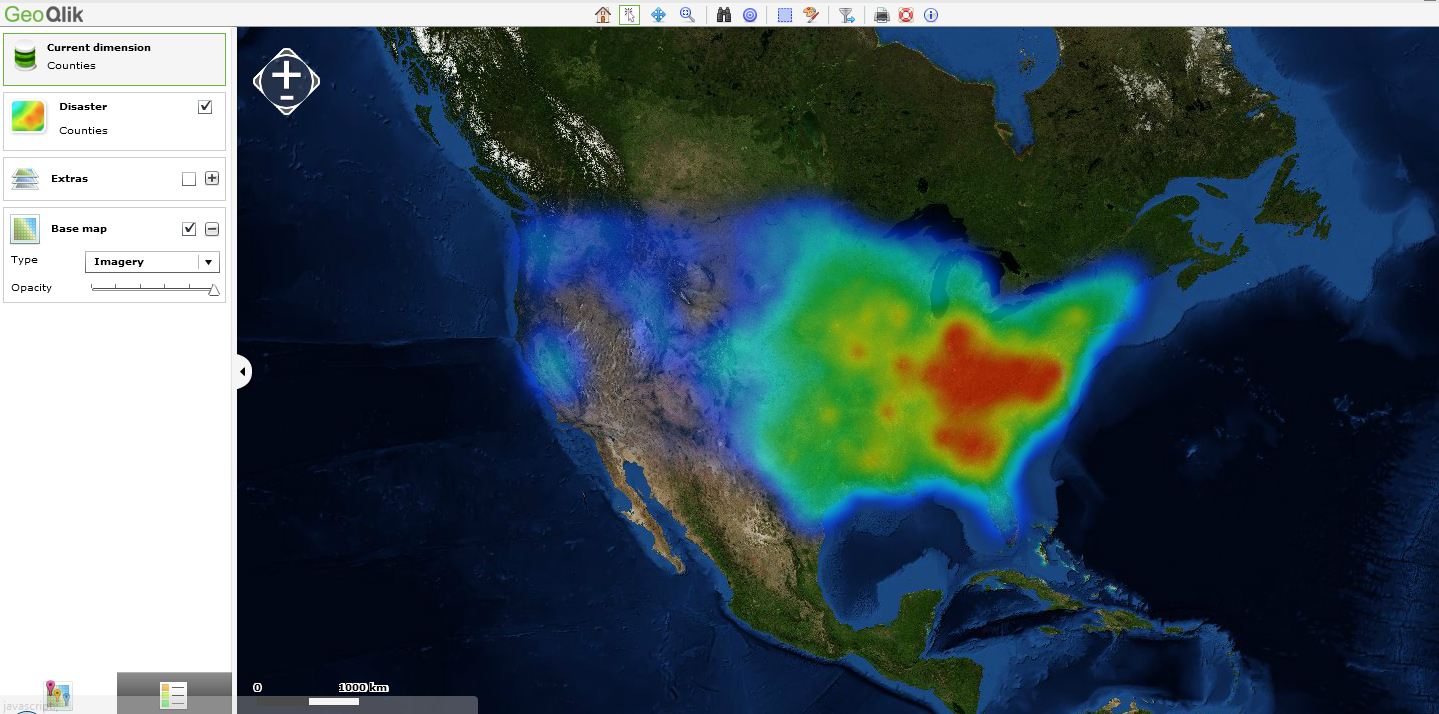
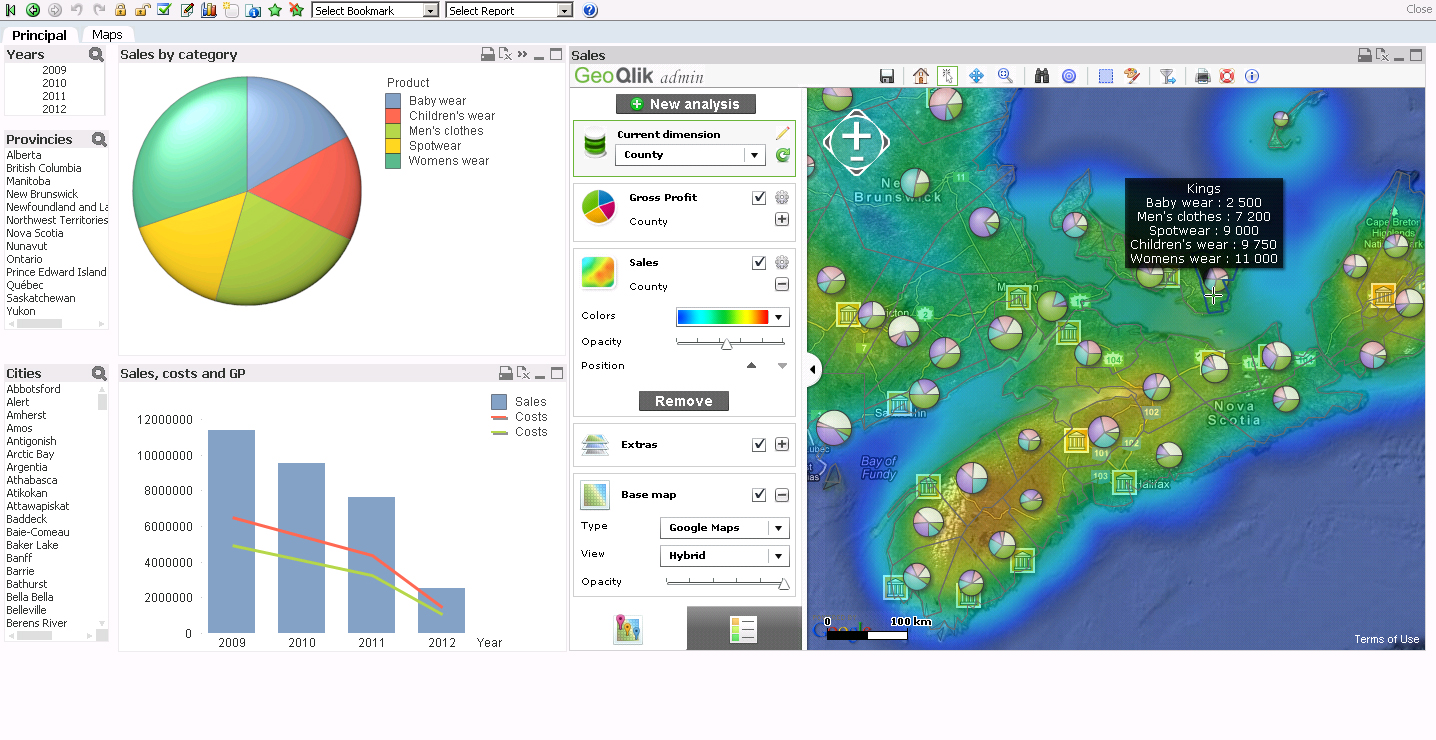
GIS/Maps Analytics in QlikView is a very interesting topic and "Heat Maps" are one of the ways to display QlikVIew KPI indicators and to represent a density on a Geografic map (ex: population, deliveries, etc.)
QlikView customers and channel parners are interested in displaying their QlikView KPI indicators on Geographic maps but also sometimes on a Building Plan (ex: logistic warehouse, supermarket, hospital, etc).
Business Geografic has developed a mapping extension for QlikView (V9, V10, V11) namely "GeoQlik" and we have been a Technology Partner of QlikTech since 2006 starting with QlikView 8!
I hereby suggest you to have a look at our new mapping extension for QlikView 11 "SR1": GeoQlik v11.6:
http://www.geoqlik.com/en/geoqlik-for-qlikview/geoqlik-v11.html
Please find hereafter a few "Heat Maps" screenshots of GeoQlik V11.6 using WMS/TMS services to display QlikView KPIs: