Unlock a world of possibilities! Login now and discover the exclusive benefits awaiting you.
- Qlik Community
- :
- All Forums
- :
- QlikView App Dev
- :
- Re: Get previous month value with Set analysis
- Subscribe to RSS Feed
- Mark Topic as New
- Mark Topic as Read
- Float this Topic for Current User
- Bookmark
- Subscribe
- Mute
- Printer Friendly Page
- Mark as New
- Bookmark
- Subscribe
- Mute
- Subscribe to RSS Feed
- Permalink
- Report Inappropriate Content
Get previous month value with Set analysis
Hello,
After spending hours on this I decided to seek your help as I cannot find a solution, and I am sure it is quite simple, but I am a beginner in QV.
I have Excel source files where data is reported in YTD cumulated.
I would like to present it for each month in both cumulated and monthly figures, therefore I need to “de-cumulate” data.
The calculation is quite simple :
Current month Monthly figure = Current month Cumulated YTD – Previous Month Cumulated YTD, except for January where Current Month Monthly figure = Current month Cumulated YTD
This is applicable only if there is a value in current month, otherwise it should return 0 for monthly figure.
I have searched in numerous forum posts, found various solution which I have tired, using variables, set analysis, Above() function…without success.
In my data model, indicators names are entered as values under the INDICATOR_ID field, and I am using set analysis to present data in charts and graphs.
I am sure it is possible with the set analysis to get the previous period and then perform a difference between current month and previous month but I cannot find how for the given INDICATOR_ID.
Another option would be to use the load script to de-cumulate data and transform cumulated into monthly figures, but I would prefer to avoid this and use data which was found in the source file directly in QV.
You will find attached the QV file, the XLS source file and the table I would like to get as a result.
Your help will be greatly appreciated !
- « Previous Replies
-
- 1
- 2
- Next Replies »
Accepted Solutions
- Mark as New
- Bookmark
- Subscribe
- Mute
- Subscribe to RSS Feed
- Permalink
- Report Inappropriate Content
sorry, didn't read the requirement correctly.
as Bhasker noted, what you want to achieve is not possible (?) using straightforward set analysis.
as you want to get monthly values from accumulated ones (IMHO, a nightmare), you need to script this...
in attachment a similar approach as Bhasker:
1. load table with your data but not in its final form,
2. create a calendar from the 1st date to the last available in your data
3. create an entry for all possible combinations of Site, Indicator, YearMonth
4. Add Data field or 0 for all combinations where they exist
4bis: sort records for interrecord caluclations
5. perform the calculations (and replace with null() where necessary
- Mark as New
- Bookmark
- Subscribe
- Mute
- Subscribe to RSS Feed
- Permalink
- Report Inappropriate Content
Hi,
Please find attached the Qvw. that full fill your requirement through back end (scripting)
frankly speaking,i really don`t have idea how we can archive this in front end using set Analysis.
if you found this helpful, please mark this as helpful or correct
Regards,
Bhasker Kumar
- Mark as New
- Bookmark
- Subscribe
- Mute
- Subscribe to RSS Feed
- Permalink
- Report Inappropriate Content
Hi,
Thanks for you super quick answer. It seems to work, however I am not sure to fully understand how you did this in your script, could you explain your script in more detail ?
Also I would much prefer to do this using Set Analysis and not manipulate the data in the script, because then I lose the ability to use Indicator_ID field.
Anyone else has an idea on how to do this using Ste Analysis ?
- Mark as New
- Bookmark
- Subscribe
- Mute
- Subscribe to RSS Feed
- Permalink
- Report Inappropriate Content
try creating a master calendar in your script: Creating A Master Calendar
(please use this as a base example, but dont use these fields:
- YeartoDate(TempDate)*-1 as CurYTDFlag,
- YeartoDate(TempDate,-1)*-1 as LastYTDFlag,
it should however contain all useful calendar fields, plus: add a sequential numeric value (MonthSerial) to each of the sequential unique months (careful: year-month) in order to be able to create set analysis expressions like max(MonthSerial) to get the latest month; max(MonthSerial-1) to get the previous month, max(Monthserial - 12) to get last year same month,...
(*also accumulations become possible (>=max(MonthSerial-12)) to get latest 12 months, etc etc etc)
if you're confident enough with Qlik Scripting take a look at @Rob Wunderlich's QV Components: https://github.com/RobWunderlich/Qlikview-Components/blob/master/QVC_Source/Qvc_Calendar.qvs
it contains examples for these sequential fields:
AutoNumber(MonthStart(Date),'$(_f_MonthSerial)') as $(_f_MonthSerial),
AutoNumber(QuarterStart(Date),'$(_f_QuarterSerial)') as $(_f_QuarterSerial),
AutoNumber(weekyear(Date) &'|' & week(Date),'$(_f_WeekSerial)') as $(_f_WeekSerial),
good luck
- Mark as New
- Bookmark
- Subscribe
- Mute
- Subscribe to RSS Feed
- Permalink
- Report Inappropriate Content
Thanks for the reply. I am not sure to see how creating a Master calendar can help but I will try
- Mark as New
- Bookmark
- Subscribe
- Mute
- Subscribe to RSS Feed
- Permalink
- Report Inappropriate Content
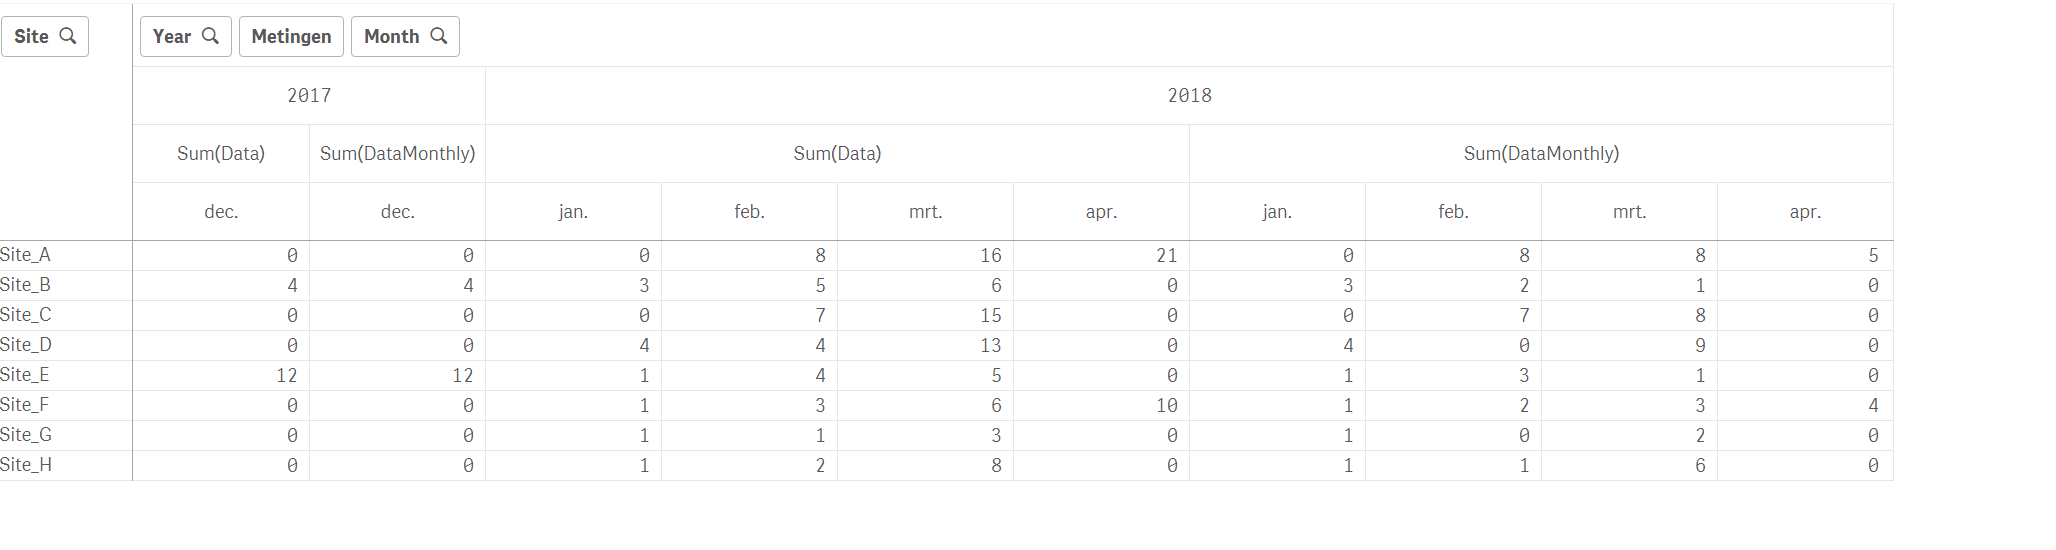
Hi,
I have built a Master Calendar in my script to follow your advice. I have tried to set up my new chart using the fields created in the Master Calendar, but it still does not work. See attached what I have done.
I am struggling with this for several hours now, without success.
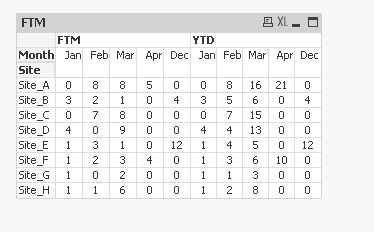
What I would like to see is the table below, it looks quite simple but I cannot get it right.
| Cumulated YTD | Monthly | |||||||
| Month | Jan | Feb | Mar | Apr | Jan | Feb | Mar | Apr |
| Site | ||||||||
| Site_A | 0 | 8 | 16 | 21 | 0 | 8 | 8 | 5 |
| Site_B | 3 | 5 | 6 | - | 3 | 2 | 1 | - |
| Site_C | 0 | 7 | 15 | - | 0 | 7 | 8 | - |
| Site_D | 4 | 4 | 13 | - | 4 | 0 | 9 | - |
| Site_E | 1 | 4 | 5 | - | 1 | 3 | 1 | - |
| Site_F | 1 | 3 | 6 | 10 | 1 | 2 | 3 | 4 |
| Site_G | 1 | 1 | 3 | - | 1 | 0 | 2 | - |
| Site_H | 1 | 2 | 8 | - | 1 | 1 | 6 | - |
Any help would be much appreciated.
- Mark as New
- Bookmark
- Subscribe
- Mute
- Subscribe to RSS Feed
- Permalink
- Report Inappropriate Content
sorry, didn't read the requirement correctly.
as Bhasker noted, what you want to achieve is not possible (?) using straightforward set analysis.
as you want to get monthly values from accumulated ones (IMHO, a nightmare), you need to script this...
in attachment a similar approach as Bhasker:
1. load table with your data but not in its final form,
2. create a calendar from the 1st date to the last available in your data
3. create an entry for all possible combinations of Site, Indicator, YearMonth
4. Add Data field or 0 for all combinations where they exist
4bis: sort records for interrecord caluclations
5. perform the calculations (and replace with null() where necessary
- Mark as New
- Bookmark
- Subscribe
- Mute
- Subscribe to RSS Feed
- Permalink
- Report Inappropriate Content
- Mark as New
- Bookmark
- Subscribe
- Mute
- Subscribe to RSS Feed
- Permalink
- Report Inappropriate Content
and the app
- Mark as New
- Bookmark
- Subscribe
- Mute
- Subscribe to RSS Feed
- Permalink
- Report Inappropriate Content
Thanks. I thought that it was simple but apparently it is not simple !
However I cannot open your file, I am currently using Qlikview 9 and it seems that this is using a more recent version of QV ?
Can you share a file that I can open with QV9 ?
- « Previous Replies
-
- 1
- 2
- Next Replies »