Unlock a world of possibilities! Login now and discover the exclusive benefits awaiting you.
- Qlik Community
- :
- All Forums
- :
- QlikView App Dev
- :
- Get the Value which is difference of current and p...
- Subscribe to RSS Feed
- Mark Topic as New
- Mark Topic as Read
- Float this Topic for Current User
- Bookmark
- Subscribe
- Mute
- Printer Friendly Page
- Mark as New
- Bookmark
- Subscribe
- Mute
- Subscribe to RSS Feed
- Permalink
- Report Inappropriate Content
Get the Value which is difference of current and previous value of the same field
Hi all,
I am facing an issue wherein I want to display the Metric in the pivot chart. The value is difference of current value and previous value of the same field
| Country | Sector | Region | Volume | Period |
| India | Automobile | South | 130 | 0 |
| US | HealthCare | South | 140 | 0 |
| UK | Tourism | West | 150 | 0 |
| JPN | Tech | North | 100 | 0 |
| India | Automobile | South | 180 | 3 |
| US | HealthCare | South | 200 | 3 |
| UK | Tourism | West | 300 | 3 |
| JPN | Tech | North | 50 | 3 |
| India | Automobile | South | 230 | 6 |
| US | HealthCare | South | 300 | 6 |
| UK | Tourism | West | 400 | 6 |
| JPN | Tech | North | 100 | 6 |
What I desire is:
| Country | Sector | Q0 | Q1 (Q1-Q0) | Q2 (Q2-Q1 |
| India | Automobile | 0 | 180-130 | 230-180 |
| US | HealthCare | 0 | 200-140 | 300-200 |
| UK | Tourism | 0 | 300-150 | 400-300 |
| JPN | TECH | 0 | 50-100 | 100-50 |
Tried using the below expression:
(Sum(Volume)-Before(Sum(Voilume),1))
The issue with this expression is that when I select any quarter, it does not work. If I don't select any quarter it works fine.
I tried to generate this field in my load script, but the numbers are not adding up.
- « Previous Replies
-
- 1
- 2
- Next Replies »
- Mark as New
- Bookmark
- Subscribe
- Mute
- Subscribe to RSS Feed
- Permalink
- Report Inappropriate Content
You point out an issue very similar to what I'd said.
"...user confusion about what is being selected when there are two different Period fields..."
I would probably hide the original Period field, and only let the users select the As Of Period field. And then to try to help avoid user confusion, I might change the name of Period to Real Period, and As Of Period to Period. So from the user's perspective, they're selecting the Period like normal. The problem then is that without further effort, every expression in the whole application has to take into account the fact that when they select a Period, you actually end up with two Real Periods being selected, and you have to exclude the one you don't want. I rarely use As Of tables, partly for this reason. When I have, I believe what I did was something more like this:
Period, Type, Real Period
0,Current,0
3,Current,3
6,Current,6
3,Previous,0
6,Previous,3
And then on open of the document, triggered selecting and locking Type = 'Current'. At that point, expressions will behave as you would expect them to when selecting the Period. The only time you need to worry about it is when you want something other than the current period. So then your chart would be like this:
Dimensions = Country, Sector, Period
Current Quarter = sum(Volume)
Difference Based on Quarters = [Current Quarter] - sum({<Type={'Previous'}>} Volume)
Our data model is no longer handling everything for us, and we're using set analysis to get the previous period. And that's fine, just not as clean a solution as I'd hope for.
- Mark as New
- Bookmark
- Subscribe
- Mute
- Subscribe to RSS Feed
- Permalink
- Report Inappropriate Content
Hi John,
Need your help here. I have used the AsOf table to get the above logic working.
Now I am facing the issue wherein I need to show the Total, Average or some other calc as 2-QTR,4QTR,9-QTR.
I have to present it like below:
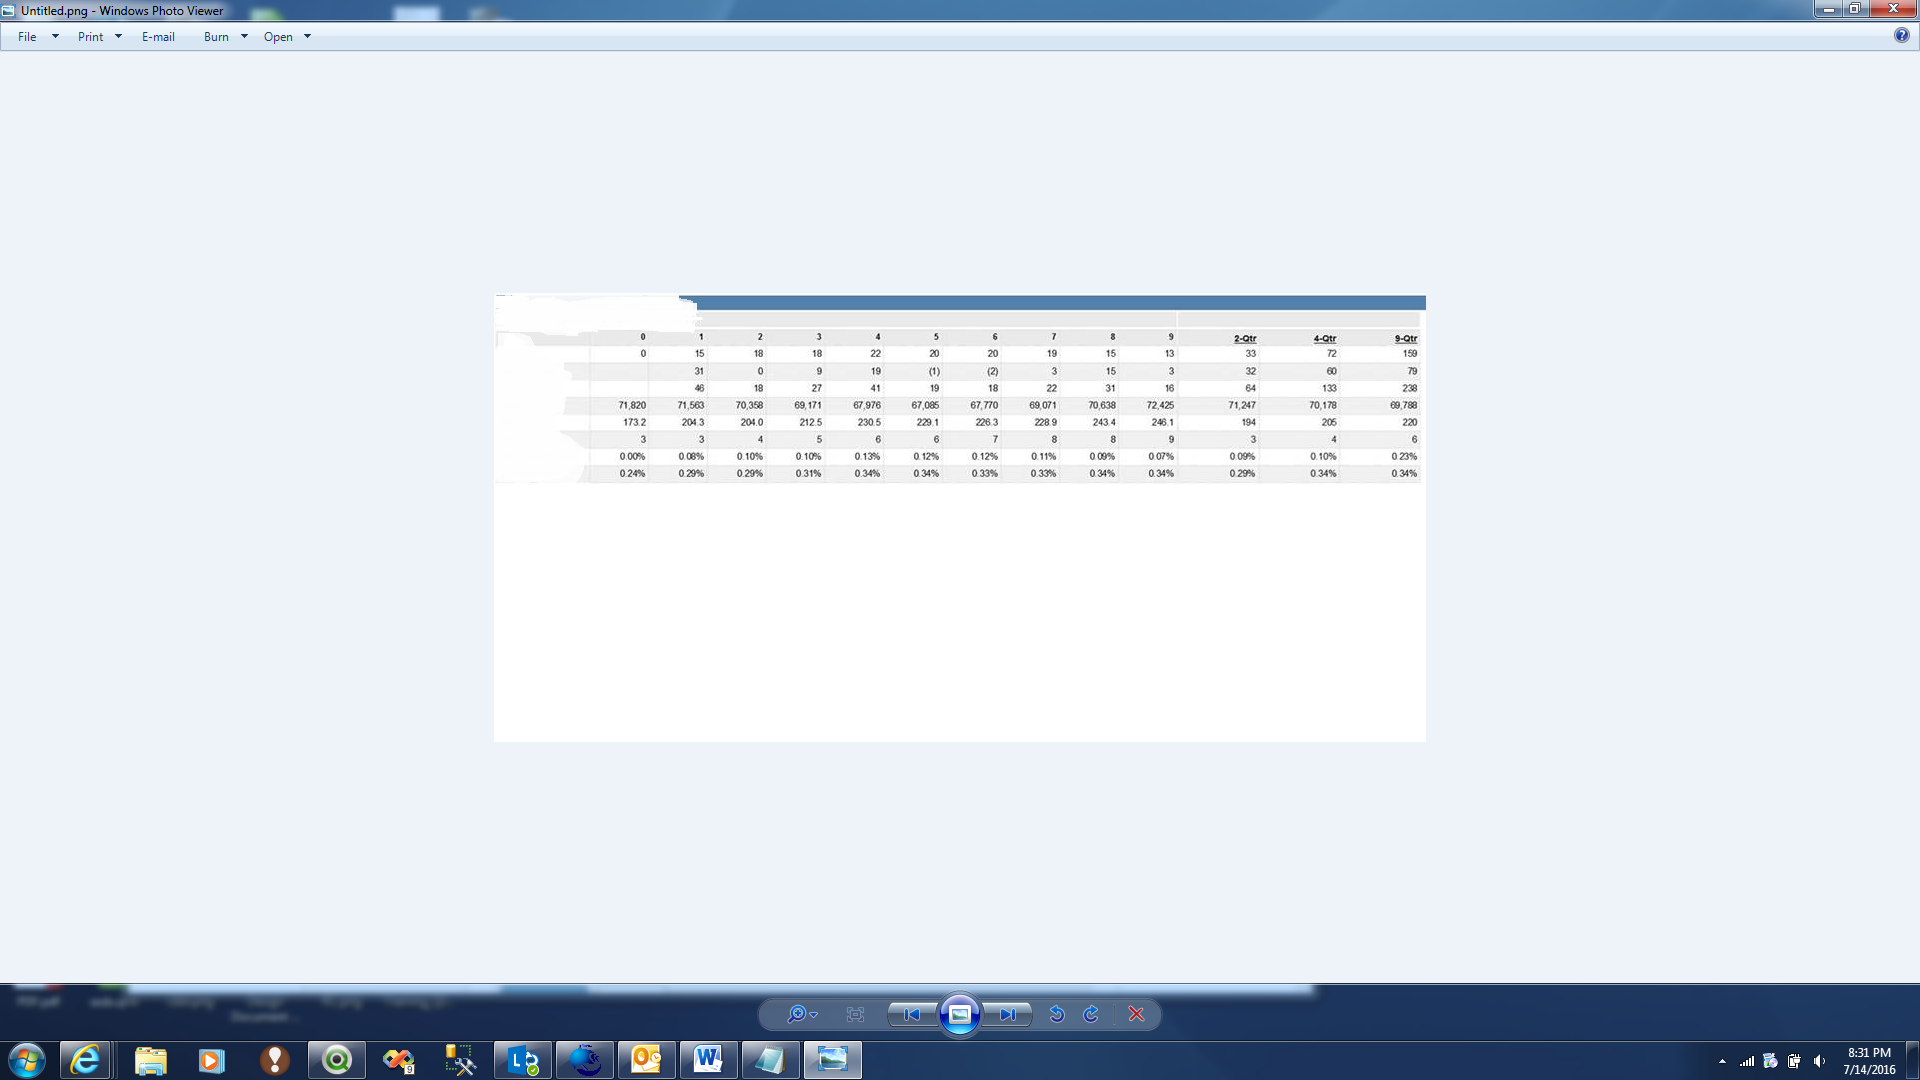 .
.
I have got the calcs for this, but I am not sure how will I present it in pivot chart. If I add these as new expressions, it will add a new row rather than a new coulmns.
Please suggest
- « Previous Replies
-
- 1
- 2
- Next Replies »