Unlock a world of possibilities! Login now and discover the exclusive benefits awaiting you.
- Qlik Community
- :
- All Forums
- :
- QlikView App Dev
- :
- Get value of each month's last date
- Subscribe to RSS Feed
- Mark Topic as New
- Mark Topic as Read
- Float this Topic for Current User
- Bookmark
- Subscribe
- Mute
- Printer Friendly Page
- Mark as New
- Bookmark
- Subscribe
- Mute
- Subscribe to RSS Feed
- Permalink
- Report Inappropriate Content
Get value of each month's last date
Hello Guyz,
I have the following table
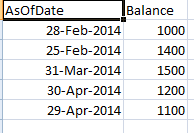
I want to get the value of each month last date, like from the above table I would like to get values like
For Feb 1000
For March 1500
For April 1200
and want to display in the bar chart (in the document).
Please guide how can I achieve this.
The document and excel file are attached.
Regards,
Muhammad Raza
Accepted Solutions
- Mark as New
- Bookmark
- Subscribe
- Mute
- Subscribe to RSS Feed
- Permalink
- Report Inappropriate Content
Use the firstsortedvalue function: firstsortedvalue(Balance, -AsOfDate). See attached qvw.
talk is cheap, supply exceeds demand
- Mark as New
- Bookmark
- Subscribe
- Mute
- Subscribe to RSS Feed
- Permalink
- Report Inappropriate Content
Use the firstsortedvalue function: firstsortedvalue(Balance, -AsOfDate). See attached qvw.
talk is cheap, supply exceeds demand
- Mark as New
- Bookmark
- Subscribe
- Mute
- Subscribe to RSS Feed
- Permalink
- Report Inappropriate Content
thank you so much, it is solved!
- Mark as New
- Bookmark
- Subscribe
- Mute
- Subscribe to RSS Feed
- Permalink
- Report Inappropriate Content
HI,
can u please share me the script as iam unable to download Qvw file
regards
Mahesh T
- Mark as New
- Bookmark
- Subscribe
- Mute
- Subscribe to RSS Feed
- Permalink
- Report Inappropriate Content
Hello @Gysbert_Wassenaar
I have similar issue but I am unable to download the qvw due to some restrictions.
Could you please share the script here ?
Thanks in advance
- Mark as New
- Bookmark
- Subscribe
- Mute
- Subscribe to RSS Feed
- Permalink
- Report Inappropriate Content
@Aspiring_Developer Try this
Script
LOAD *,
Month(Date(Date#(AsOfDate,'DD-MMM-YYYY'),'DD/MM/YYYY')) as Month
Inline[
AsOfDate,Balance
28-Feb-2014,1000
25-Feb-2014,1400
31-Mar-2014,1500
30-Apr-2014,1200
29-Apr-2014,1100
];
Expression
FirstSortedValue(Balance,-aggr(Sum(Balance),Month),1)