Unlock a world of possibilities! Login now and discover the exclusive benefits awaiting you.
- Qlik Community
- :
- All Forums
- :
- QlikView App Dev
- :
- Getting String value from a Column depending on MA...
- Subscribe to RSS Feed
- Mark Topic as New
- Mark Topic as Read
- Float this Topic for Current User
- Bookmark
- Subscribe
- Mute
- Printer Friendly Page
- Mark as New
- Bookmark
- Subscribe
- Mute
- Subscribe to RSS Feed
- Permalink
- Report Inappropriate Content
Getting String value from a Column depending on MAX function N
Hi there,
Its been a hole day trying to figure this out, exhausted I requesting some help from you guys.
See attachment for sample data:
I got a chart with Division, Metric as dimensions, now I need to replicate for 22 Columns (yes, I'm going crazy):
- Date: First Column: is the last informed date from that Division and Metric
- Status: Second Column: the status of date of the first column
- Second Column Date:: the second last informed date
- Status: Second Column: the status of date of the Second column
- and so on for 22...

Well, what i have accomplished, basically nothing... for date column, i got it solve by using this expression:
- MAX(Date, N) which reflects the correct date regardless of the span of each Division Metric (Quartely, Monthly, Daily).
Now... I'm going mad trying to get status, I've tried Only, FirstSortedValue, Set analysis.... Can anyone of the community, just tell me.. dude, this is fairly obvious, you need to....
IMPORTANT CAN'T ALTER SCRIPT (damn policies)
Thanks in advance!
Accepted Solutions
- Mark as New
- Bookmark
- Subscribe
- Mute
- Subscribe to RSS Feed
- Permalink
- Report Inappropriate Content
I couldn't resist the temptation to try out the last suggestion in my last answer myself - the one about using a PIVOT to achieve a compact table. It works fine:
![2017-01-08 01_58_46-QlikView x64 - [C__Users_psd_Downloads_Pivot.qvw_].png](/legacyfs/online/148665_2017-01-08 01_58_46-QlikView x64 - [C__Users_psd_Downloads_Pivot.qvw_].png)
![2017-01-08 02_21_57-QlikView x64 - [C__Users_psd_Downloads_Pivot2.qvw_].png](/legacyfs/online/148666_2017-01-08 02_21_57-QlikView x64 - [C__Users_psd_Downloads_Pivot2.qvw_].png)
I attached two QVWs that shows the concept with both your datasets.
- Mark as New
- Bookmark
- Subscribe
- Mute
- Subscribe to RSS Feed
- Permalink
- Report Inappropriate Content
You can also do it with a pivot table which is much easier but you can get an insane amount of columns.
I have shown both approaches here and attached the example application:
![2017-01-06 00_10_30-QlikView x64 - [C__Users_psd_Downloads_Pivot.qvw_].png](/legacyfs/online/148513_2017-01-06 00_10_30-QlikView x64 - [C__Users_psd_Downloads_Pivot.qvw_].png)
- Mark as New
- Bookmark
- Subscribe
- Mute
- Subscribe to RSS Feed
- Permalink
- Report Inappropriate Content
Hi Petter,
first, thanks for the replay. You are correct indeed, i also thought about a pivot table and using date as default column, and as you mention i get lots of dates. That approach wont work because I will get something like this:

As you can see, in Division1 Metric B, should show the last informed status of that metric as the first column (in the new sample data should be 01-12-2015). So pivot table is discarded.
The other approach wont work either, cause I need to inform the last informed status of each Div-metric 22 times. Using the snippet you provided I'll get something like this:
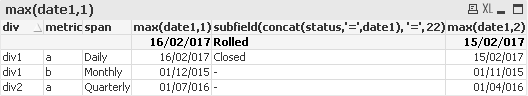
Division1 Metric A is correctly displayed, but once again, metrics that don't have been informed more than 22 times wont show like Division1-Metric B, there are some metrics that are yearly.
Any thoughts in how to approach this?
One again thanks for the replay, I really appreciate,
- Mark as New
- Bookmark
- Subscribe
- Mute
- Subscribe to RSS Feed
- Permalink
- Report Inappropriate Content
Yes Martin I do have some more suggestions for you:
You can either use a descending sort in the Concat( stats , '=' , -date1) notice the minus in front of date1. This will get the concatenated string of stats to be in the reverse order and you can start picking from 1 and upwards.
The other option would be to use a negative value in front of the element number you want to pick in the SubField-function. That way you start picking from the right and not the left. This is basically another way of doing what I suggested in the previous paragraph.
So instead of having
Subfield( Concat( stats , '=' , date1) , '=' , 22 )
you would have
Subfield( Concat( stats , '=' , date1) , '=' , -1 ) // Pick from the last one
Lastly I still think that it would be possible to use a pivot table. Instead of using as a dimension the actual date you could have a sequence number for the dates as a dimension that follows the dates. For each div, metric and span you would get a running sequence of 1 to n for each date within each row. Then as a measure you could have a concatenated date with the stats in a string that could be shown in each cell. That would leave you with a table quite similar to the straight table.
- Mark as New
- Bookmark
- Subscribe
- Mute
- Subscribe to RSS Feed
- Permalink
- Report Inappropriate Content
I couldn't resist the temptation to try out the last suggestion in my last answer myself - the one about using a PIVOT to achieve a compact table. It works fine:
I attached two QVWs that shows the concept with both your datasets.
- Mark as New
- Bookmark
- Subscribe
- Mute
- Subscribe to RSS Feed
- Permalink
- Report Inappropriate Content
Hi petter-s,
I'm astonished on how you approached the issue. I've never though of it and learned a few things on the way.
Performance is more than fine, I was scared this would take several minutes to refresh, but only takes a few seconds with the real app data.
Thanks for the examples you provided, your time and ideas 